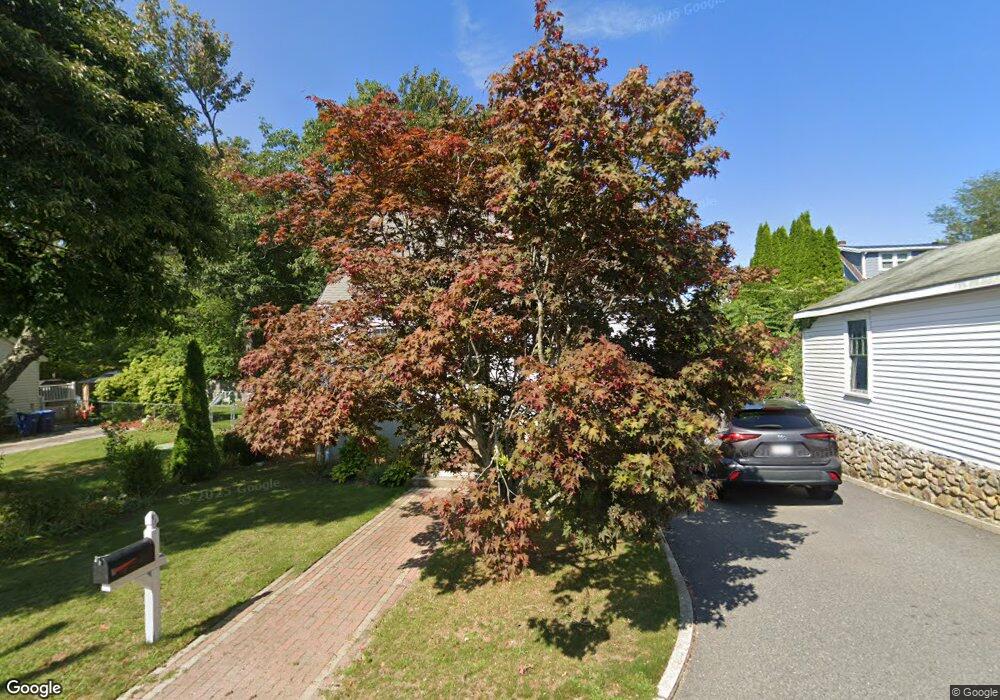
20 Sagamore St Braintree, MA 02184
South Braintree NeighborhoodEstimated Value: $672,493 - $754,000
3
Beds
2
Baths
1,365
Sq Ft
$521/Sq Ft
Est. Value
About This Home
This home is located at 20 Sagamore St, Braintree, MA 02184 and is currently estimated at $710,623, approximately $520 per square foot. 20 Sagamore St is a home located in Norfolk County with nearby schools including Braintree High School, Sacred Heart Elementary School, and Thayer Academy.
Ownership History
Date
Name
Owned For
Owner Type
Purchase Details
Closed on
Oct 26, 2023
Sold by
Skapeta Dimitri
Bought by
Skapeta Chris and Skapeta Andre
Current Estimated Value
Purchase Details
Closed on
Nov 12, 2003
Sold by
Macdonald William A and Macdonald Lynne M
Bought by
Skapeta Dimitri and Skapeta Eglantina
Home Financials for this Owner
Home Financials are based on the most recent Mortgage that was taken out on this home.
Original Mortgage
$276,000
Interest Rate
5.81%
Mortgage Type
Purchase Money Mortgage
Create a Home Valuation Report for This Property
The Home Valuation Report is an in-depth analysis detailing your home's value as well as a comparison with similar homes in the area
Home Values in the Area
Average Home Value in this Area
Purchase History
| Date | Buyer | Sale Price | Title Company |
|---|---|---|---|
| Skapeta Chris | -- | None Available | |
| Skapeta Dimitri | -- | None Available | |
| Skapeta Dimitri | $345,000 | -- |
Source: Public Records
Mortgage History
| Date | Status | Borrower | Loan Amount |
|---|---|---|---|
| Previous Owner | Skapeta Dimitri | $305,000 | |
| Previous Owner | Skapeta Dimitri | $276,000 | |
| Previous Owner | Skapeta Dimitri | $34,500 | |
| Previous Owner | Skapeta Dimitri | $65,000 |
Source: Public Records
Tax History Compared to Growth
Tax History
| Year | Tax Paid | Tax Assessment Tax Assessment Total Assessment is a certain percentage of the fair market value that is determined by local assessors to be the total taxable value of land and additions on the property. | Land | Improvement |
|---|---|---|---|---|
| 2025 | $5,822 | $583,400 | $314,500 | $268,900 |
| 2024 | $5,374 | $566,900 | $293,300 | $273,600 |
| 2023 | $5,092 | $521,700 | $263,500 | $258,200 |
| 2022 | $4,937 | $496,200 | $238,000 | $258,200 |
| 2021 | $4,479 | $450,200 | $215,100 | $235,100 |
| 2020 | $4,246 | $430,600 | $195,500 | $235,100 |
| 2019 | $4,126 | $408,900 | $187,000 | $221,900 |
| 2018 | $4,030 | $382,400 | $170,000 | $212,400 |
| 2017 | $3,914 | $364,400 | $161,500 | $202,900 |
| 2016 | $3,652 | $332,600 | $136,000 | $196,600 |
| 2015 | $3,576 | $323,000 | $134,300 | $188,700 |
| 2014 | $3,402 | $297,900 | $122,400 | $175,500 |
Source: Public Records
Map
Nearby Homes
- 414 John Mahar Hwy Unit 312
- 418 John Mahar Hwy Unit 408
- 428 John Mahar Hwy Unit 301
- 422 John Mahar Hwy Unit 305
- 420 John Mahar Hwy Unit 202
- 426 John Mahar Hwy Unit 311
- 86 E Boscobel St
- 42 Spring St
- 14-20 Randall Ave
- 61 Grove St
- 145 Hancock St Unit 214
- 6 Franklin St
- 67 Abby Rd
- 65 Tremont St
- 605 Middle St Unit 38
- 293 Alida Rd
- 94 Kensington St
- 131 Jefferson St
- 1307 Washington St
- 15 Highland Ave
- 12 Sagamore St
- 71 Fountain St
- 67 Fountain St
- 65 Fountain St
- 15 Columbus Ave
- 63 Fountain St
- 27 Sagamore St
- 17 Sagamore St
- 17 Sagamore St
- 13 Sagamore St
- 53 Fountain St
- 62 Fountain St
- 14 Columbus Ave
- 7 Sagamore St
- 33 Sagamore St
- 56 Fountain St
- 51 Fountain St
- 37 Sagamore St
- 39 Columbus Ave
- 42 Sagamore St