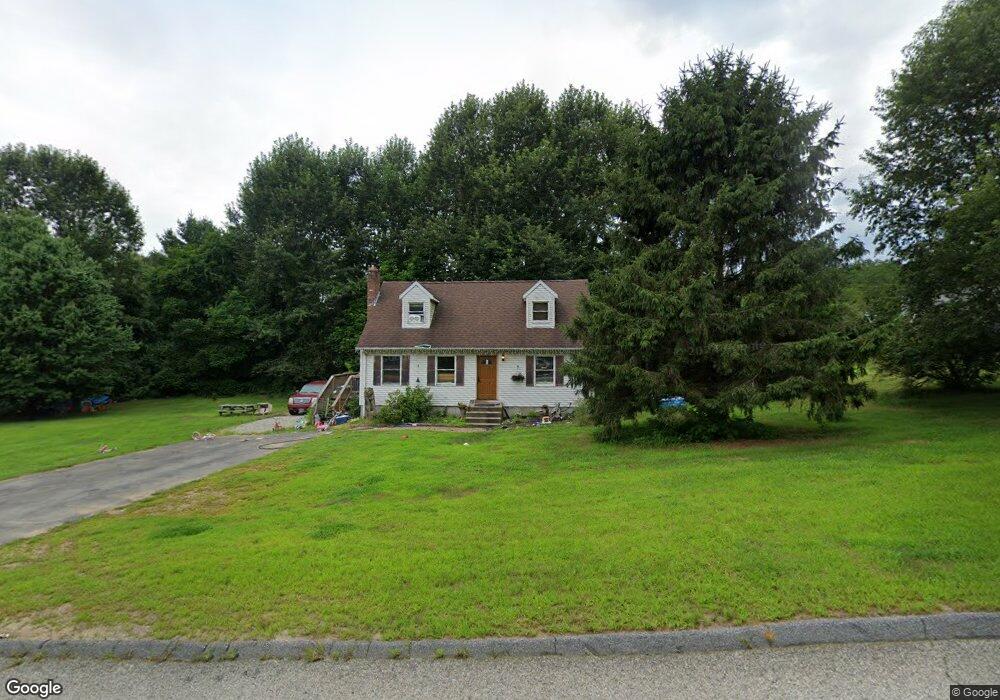
20 Shagbark Ln Canterbury, CT 06331
Estimated Value: $370,000 - $385,000
4
Beds
2
Baths
1,512
Sq Ft
$250/Sq Ft
Est. Value
About This Home
This home is located at 20 Shagbark Ln, Canterbury, CT 06331 and is currently estimated at $378,429, approximately $250 per square foot. 20 Shagbark Ln is a home located in Windham County with nearby schools including Canterbury Elementary School, Dr. Helen Baldwin Middle School, and St. Maryour Lady of the Rosary.
Ownership History
Date
Name
Owned For
Owner Type
Purchase Details
Closed on
Dec 6, 2024
Sold by
Mycroft James
Bought by
Romagnano Donevin
Current Estimated Value
Home Financials for this Owner
Home Financials are based on the most recent Mortgage that was taken out on this home.
Original Mortgage
$302,706
Outstanding Balance
$300,208
Interest Rate
6.54%
Mortgage Type
FHA
Estimated Equity
$78,221
Create a Home Valuation Report for This Property
The Home Valuation Report is an in-depth analysis detailing your home's value as well as a comparison with similar homes in the area
Home Values in the Area
Average Home Value in this Area
Purchase History
| Date | Buyer | Sale Price | Title Company |
|---|---|---|---|
| Romagnano Donevin | $350,000 | None Available | |
| Romagnano Donevin | $350,000 | None Available | |
| Romagnano Donevin | $350,000 | None Available |
Source: Public Records
Mortgage History
| Date | Status | Borrower | Loan Amount |
|---|---|---|---|
| Open | Romagnano Donevin | $302,706 | |
| Closed | Romagnano Donevin | $302,706 |
Source: Public Records
Tax History Compared to Growth
Tax History
| Year | Tax Paid | Tax Assessment Tax Assessment Total Assessment is a certain percentage of the fair market value that is determined by local assessors to be the total taxable value of land and additions on the property. | Land | Improvement |
|---|---|---|---|---|
| 2025 | $3,565 | $212,700 | $42,400 | $170,300 |
| 2024 | $4,464 | $194,100 | $38,500 | $155,600 |
| 2023 | $2,992 | $130,100 | $26,800 | $103,300 |
| 2022 | $2,992 | $130,100 | $26,800 | $103,300 |
| 2021 | $3,086 | $130,100 | $26,800 | $103,300 |
| 2020 | $3,292 | $124,700 | $26,800 | $97,900 |
| 2019 | $3,292 | $124,700 | $26,800 | $97,900 |
| 2018 | $3,267 | $124,700 | $26,800 | $97,900 |
| 2017 | $3,055 | $124,700 | $26,800 | $97,900 |
| 2016 | $3,055 | $124,700 | $26,800 | $97,900 |
| 2015 | $3,165 | $146,200 | $53,600 | $92,600 |
| 2014 | $3,143 | $146,200 | $53,600 | $92,600 |
Source: Public Records
Map
Nearby Homes
- 28 Pleasant View Cove
- 41 Arbor Rd
- 23 Quinebaug Camp Rd
- 108 Phillips Rd
- 8 Harvest Rd
- 144 Kimball Rd
- 165 Kimball Rd
- 68 Roode Rd
- 20 Potts Rd
- 38 Sergeants Way
- 12 William St
- 13 Central Ave
- 340 E Main St
- 170 Bishop Crossing Rd
- 672 Roode Rd
- 31 Palmer Ave
- 71 Lake Rd
- 158 N Burnham Hwy
- 83 Bushnell Rd
- 0 Bennett Pond Rd