R
Seller's Agent in 2012
Rachel Belanger
RE/MAX
Estimated Value: $346,000 - $456,465
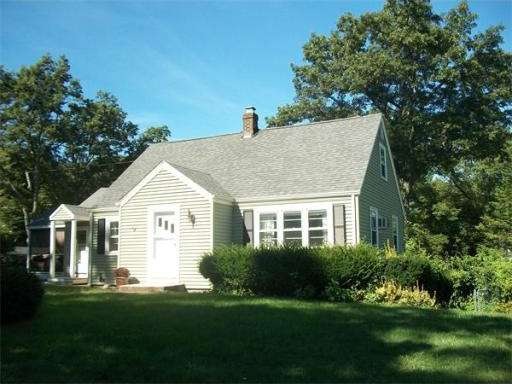
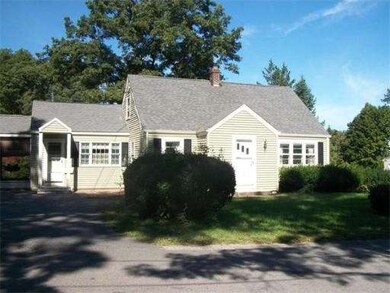
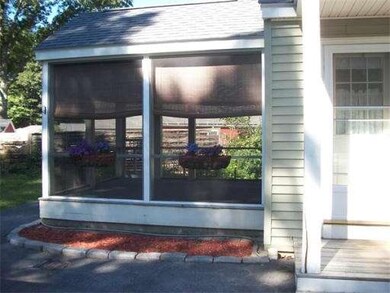
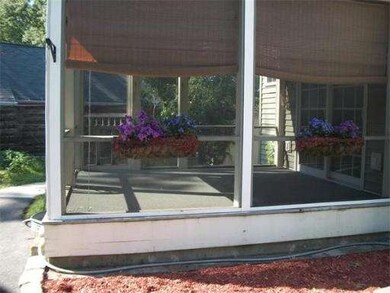
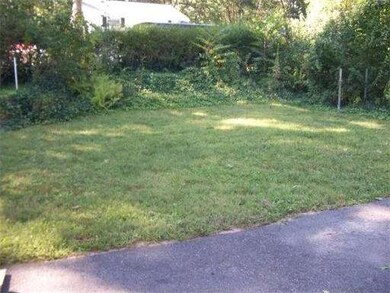
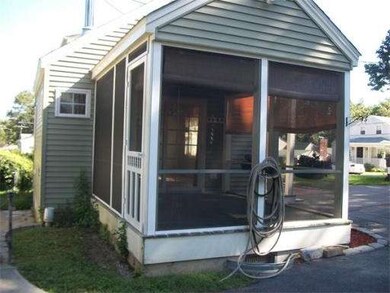
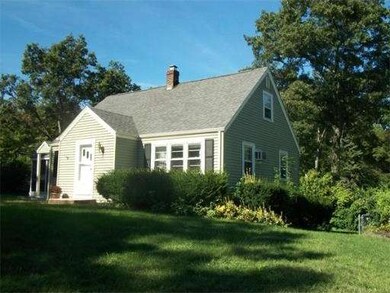
New addition familyroom with Anderson windows, cath ceiling and wood stove (w/permit). Eat-in kitchen, dining room, livingroom and first floor bedroom. Two full baths, first floor laundry, hardwoods, natural woodwork, two zone heat, circuit breakers, new liner for chimney plus an awesome screened-in porch. Very little to do - just move in and enjoy.
Last Agent to Sell the Property
Rachel Belanger
RE/MAX Advantage 1 License #453001036 Listed on: 09/11/2012
Home Type
Single Family
Est. Annual Taxes
$4,654
Year Built
1955
Lot Details
0
| Date | Status | Borrower | Loan Amount |
|---|---|---|---|
| Closed | Paris Derek G | $184,300 | |
| Closed | Sherman George E | $375,000 |
| Date | Event | Price | Change | Sq Ft Price |
|---|---|---|---|---|
| 11/07/2012 11/07/12 | Sold | $190,000 | -2.5% | $124 / Sq Ft |
| 09/26/2012 09/26/12 | Pending | -- | -- | -- |
| 09/11/2012 09/11/12 | For Sale | $194,900 | -- | $127 / Sq Ft |
| Year | Tax Paid | Tax Assessment Tax Assessment Total Assessment is a certain percentage of the fair market value that is determined by local assessors to be the total taxable value of land and additions on the property. | Land | Improvement |
|---|---|---|---|---|
| 2025 | $4,654 | $347,600 | $105,800 | $241,800 |
| 2024 | $4,271 | $322,800 | $98,000 | $224,800 |
| 2023 | $3,810 | $263,700 | $68,700 | $195,000 |
| 2022 | $3,813 | $254,200 | $68,700 | $185,500 |
| 2021 | $709 | $246,900 | $68,700 | $178,200 |
| 2020 | $9,833 | $240,600 | $68,700 | $171,900 |
| 2019 | $3,712 | $234,200 | $62,400 | $171,800 |
| 2018 | $3,637 | $222,600 | $62,400 | $160,200 |
| 2017 | $10,868 | $197,600 | $62,400 | $135,200 |
| 2016 | $3,200 | $194,400 | $62,400 | $132,000 |
| 2015 | $3,210 | $195,000 | $66,400 | $128,600 |
| 2014 | $3,205 | $187,400 | $66,400 | $121,000 |
R
Seller's Agent in 2012
Rachel Belanger
RE/MAX

Buyer's Agent in 2012
Joanna King
Champion Real Estate, Inc.
(508) 769-4116
51 Total Sales
Source: MLS Property Information Network (MLS PIN)
MLS Number: 71433513
APN: MILB-000005-000000-000046
Disclaimer: Certain information contained herein is derived from information provided by parties other than Homes.com. All information provided is deemed reliable, but is not guaranteed to be accurate and should be independently verified.
![]() The property listing data and information, or the Images, set forth herein were provided to MLS Property Information Network, Inc. from third party sources, including sellers, lessors and public records, and were compiled by MLS Property Information Network, Inc. The property listing data and information, and the Images, are for the personal, non-commercial use of consumers having a good faith interest in purchasing or leasing listed properties of the type displayed to them and may not be used for any purpose other than to identify prospective properties which such consumers may have a good faith interest in purchasing or leasing. MLS Property Information Network, Inc. and its subscribers disclaim any and all representations and warranties as to the accuracy of the property listing data and information, or as to the accuracy of any of the Images, set forth herein.
The property listing data and information, or the Images, set forth herein were provided to MLS Property Information Network, Inc. from third party sources, including sellers, lessors and public records, and were compiled by MLS Property Information Network, Inc. The property listing data and information, and the Images, are for the personal, non-commercial use of consumers having a good faith interest in purchasing or leasing listed properties of the type displayed to them and may not be used for any purpose other than to identify prospective properties which such consumers may have a good faith interest in purchasing or leasing. MLS Property Information Network, Inc. and its subscribers disclaim any and all representations and warranties as to the accuracy of the property listing data and information, or as to the accuracy of any of the Images, set forth herein.