20 Shore Crest Ct Unit 11 Donnelly, ID 83615
Estimated Value: $1,839,164 - $1,980,000
3
Beds
1
Bath
3,573
Sq Ft
$528/Sq Ft
Est. Value
About This Home
This home is located at 20 Shore Crest Ct Unit 11, Donnelly, ID 83615 and is currently estimated at $1,885,791, approximately $527 per square foot. 20 Shore Crest Ct Unit 11 is a home located in Valley County with nearby schools including Donnelly Elementary School and McCall-Donnelly High School.
Ownership History
Date
Name
Owned For
Owner Type
Purchase Details
Closed on
Jun 22, 2021
Sold by
Shandy Jerome C and Shandy Michaeline F
Bought by
Asaro Matthew and Asaro Jennifer
Current Estimated Value
Home Financials for this Owner
Home Financials are based on the most recent Mortgage that was taken out on this home.
Original Mortgage
$960,000
Outstanding Balance
$869,160
Interest Rate
2.9%
Mortgage Type
New Conventional
Estimated Equity
$1,016,631
Purchase Details
Closed on
May 21, 2009
Sold by
Shandy Jerome C and Shandy Micbaeline
Bought by
Shandy Jerome C and Shandy Michaeline F
Home Financials for this Owner
Home Financials are based on the most recent Mortgage that was taken out on this home.
Original Mortgage
$250,000
Interest Rate
4.8%
Mortgage Type
New Conventional
Purchase Details
Closed on
Jan 30, 2008
Sold by
Tcs Idaho I Lc A Llc
Bought by
Shandy Jerome C and Shandy Michaeline
Purchase Details
Closed on
Jan 27, 2006
Sold by
Crane Shores Llc
Bought by
Tcs Idaho Llc
Create a Home Valuation Report for This Property
The Home Valuation Report is an in-depth analysis detailing your home's value as well as a comparison with similar homes in the area
Home Values in the Area
Average Home Value in this Area
Purchase History
| Date | Buyer | Sale Price | Title Company |
|---|---|---|---|
| Asaro Matthew | -- | Pioneer Title Co Of Ada Cnty | |
| Shandy Jerome C | -- | -- | |
| Shandy Jerome C | -- | -- | |
| Tcs Idaho Llc | -- | -- |
Source: Public Records
Mortgage History
| Date | Status | Borrower | Loan Amount |
|---|---|---|---|
| Open | Asaro Matthew | $960,000 | |
| Previous Owner | Shandy Jerome C | $250,000 |
Source: Public Records
Tax History Compared to Growth
Tax History
| Year | Tax Paid | Tax Assessment Tax Assessment Total Assessment is a certain percentage of the fair market value that is determined by local assessors to be the total taxable value of land and additions on the property. | Land | Improvement |
|---|---|---|---|---|
| 2025 | $3,456 | $1,220,426 | $324,110 | $896,316 |
| 2023 | $3,456 | $1,235,681 | $259,288 | $976,393 |
| 2022 | $3,626 | $1,239,052 | $223,805 | $1,015,247 |
| 2021 | $3,029 | $784,443 | $119,883 | $664,560 |
| 2020 | $2,832 | $614,713 | $79,085 | $535,628 |
| 2019 | $2,844 | $581,364 | $71,896 | $509,468 |
| 2018 | $2,825 | $543,987 | $68,922 | $475,065 |
| 2017 | $2,931 | $519,761 | $68,922 | $450,839 |
| 2016 | $2,833 | $495,027 | $73,182 | $421,845 |
| 2015 | $2,373 | $406,538 | $0 | $0 |
| 2013 | -- | $416,608 | $0 | $0 |
Source: Public Records
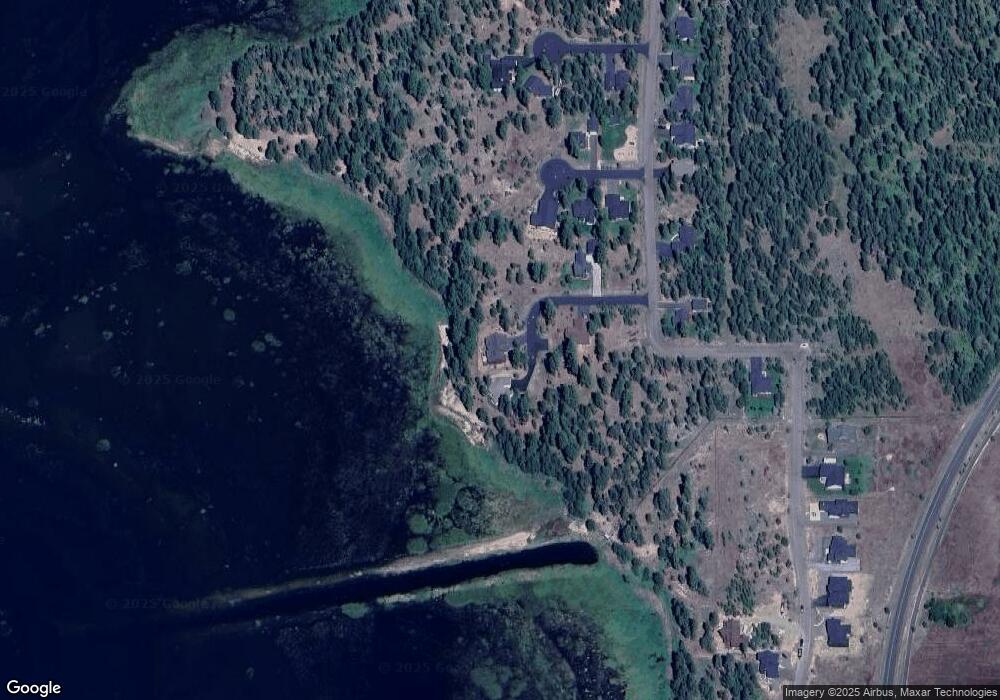
Map
Nearby Homes
- 20 Shore Crest Ct
- 13 Cross Country Ct
- 13156 Hawks Bay Rd
- 13146 Hawks Bay Rd
- 13132 Hawks Bay Rd Unit 17
- 13132 Hawks Bay Rd
- 13116 Crane Shore Dr
- 13140 Hawks Bay Rd
- 13140 Hawks Bay Rd Unit 24
- 13116 Crane Shores Dr
- TBD Herons Nest Ct
- 13124 Hawks Bay Rd
- 13126 Hawks Bay Rd
- 13130 Crane Shore Dr
- 13098 Hill House Loop
- 13116 Hawks Bay Rd Unit 9
- 13116 Hawks Bay Rd
- 13091 Hill House Loop
- 1816 Schultz
- 1816 Schultz Unit 15
- 20 Shore Crest Ct
- Lot 13 Shore Crest Ct Unit 13
- Lot 13 Shore Crest Ct
- 166 Shore Crest Ct
- 10 Shore Crest Ct Unit 16
- 11 Shore Crest Ct Unit 7
- 14 Shore Crest Ct Unit 14
- 12 Shore Crest Ct
- Lot 12 Shore Crest Ct Unit 12
- Lot 12 Shore Crest Ct
- 15 Crest Ct Unit 5
- 15 Crest Ct
- 13 Shore Crest Ct Unit 8
- 13 Shore Crest Ct
- 13085 Crane Shores Dr
- 15 White Swan Unit 19
- Lot 10 Shore Crest Ct Unit 10
- Lot 10 Shore Crest Ct
- 13086 Crane Shore Dr Unit 2
- 13086 Crane Shore Dr