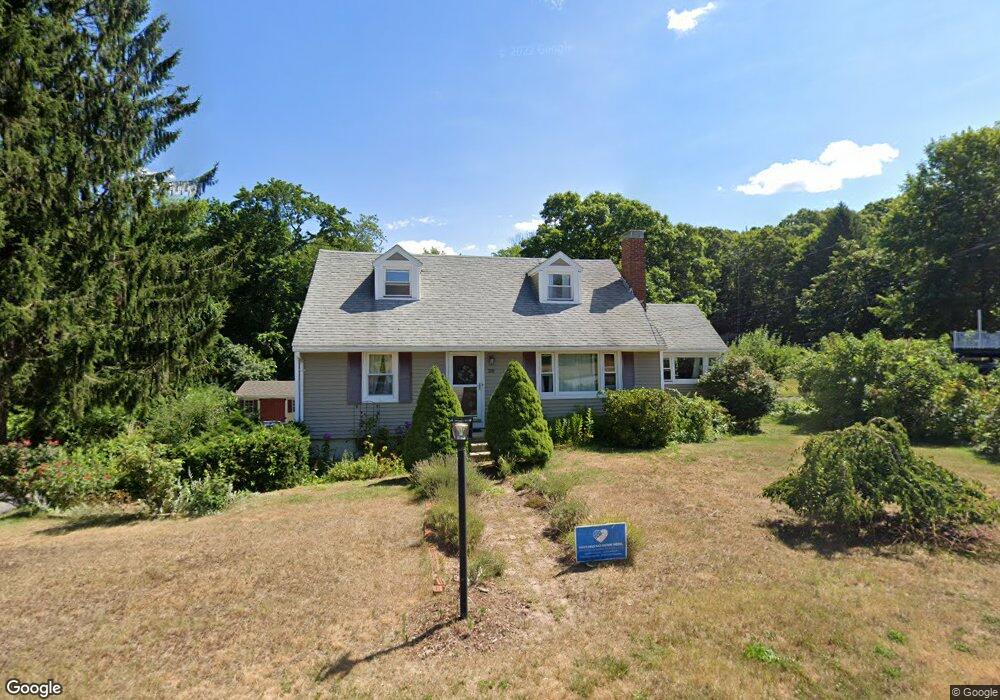
20 Spring Rd Westborough, MA 01581
Estimated Value: $549,000 - $740,000
4
Beds
2
Baths
1,624
Sq Ft
$400/Sq Ft
Est. Value
About This Home
This home is located at 20 Spring Rd, Westborough, MA 01581 and is currently estimated at $650,080, approximately $400 per square foot. 20 Spring Rd is a home located in Worcester County with nearby schools including Westborough High School, Ebridge Montessori School, and Westboro Knowledge Beginnings.
Ownership History
Date
Name
Owned For
Owner Type
Purchase Details
Closed on
Oct 11, 2024
Sold by
Luke-Mannarino Karen T
Bought by
Karen T Luke-Mannarino Lt and Luke-Mannarino
Current Estimated Value
Purchase Details
Closed on
Aug 25, 1995
Sold by
Wong Alfred and Wong Rita
Bought by
Mannarino Joseph and Mannarino Karen
Home Financials for this Owner
Home Financials are based on the most recent Mortgage that was taken out on this home.
Original Mortgage
$130,500
Interest Rate
7.32%
Mortgage Type
Purchase Money Mortgage
Create a Home Valuation Report for This Property
The Home Valuation Report is an in-depth analysis detailing your home's value as well as a comparison with similar homes in the area
Home Values in the Area
Average Home Value in this Area
Purchase History
| Date | Buyer | Sale Price | Title Company |
|---|---|---|---|
| Karen T Luke-Mannarino Lt | -- | None Available | |
| Karen T Luke-Mannarino Lt | -- | None Available | |
| Mannarino Joseph | $145,000 | -- | |
| Mannarino Joseph | $145,000 | -- |
Source: Public Records
Mortgage History
| Date | Status | Borrower | Loan Amount |
|---|---|---|---|
| Previous Owner | Mannarino Joseph | $118,000 | |
| Previous Owner | Mannarino Joseph | $80,000 | |
| Previous Owner | Mannarino Joseph | $130,500 |
Source: Public Records
Tax History
| Year | Tax Paid | Tax Assessment Tax Assessment Total Assessment is a certain percentage of the fair market value that is determined by local assessors to be the total taxable value of land and additions on the property. | Land | Improvement |
|---|---|---|---|---|
| 2025 | $8,556 | $525,200 | $316,200 | $209,000 |
| 2024 | $8,111 | $494,300 | $294,100 | $200,200 |
| 2023 | $7,733 | $459,200 | $278,700 | $180,500 |
| 2022 | $7,163 | $387,400 | $221,500 | $165,900 |
| 2021 | $6,736 | $363,300 | $197,400 | $165,900 |
| 2020 | $6,802 | $371,300 | $205,400 | $165,900 |
| 2019 | $6,516 | $355,500 | $205,400 | $150,100 |
| 2018 | $2,439 | $326,000 | $191,300 | $134,700 |
| 2017 | $2,261 | $326,000 | $191,300 | $134,700 |
| 2016 | $5,431 | $305,600 | $181,300 | $124,300 |
| 2015 | $5,359 | $288,300 | $181,300 | $107,000 |
Source: Public Records
Map
Nearby Homes
- 60 Belknap St
- 27 Spring Rd
- 7 Grindstone Ct
- 48 Lackey St
- 46 Lackey St
- 51 Lackey St
- 6 Piccadilly Way
- 352 Wood St
- 26 Mount Pleasant St
- 5 Victory Ln
- 5 Stewart St
- 4 Donna Pass
- 186 Spring St
- 1 Honeysuckle Cir
- 9 Baldwin Ct
- 14 Baldwin Ct Unit 14
- 11 Quick Farm Rd
- 15 Quick Farm Rd
- 215 North St
- 4 Quick Farm Rd
Your Personal Tour Guide
Ask me questions while you tour the home.