Estimated Value: $125,322 - $210,000
--
Bed
--
Bath
1,104
Sq Ft
$153/Sq Ft
Est. Value
About This Home
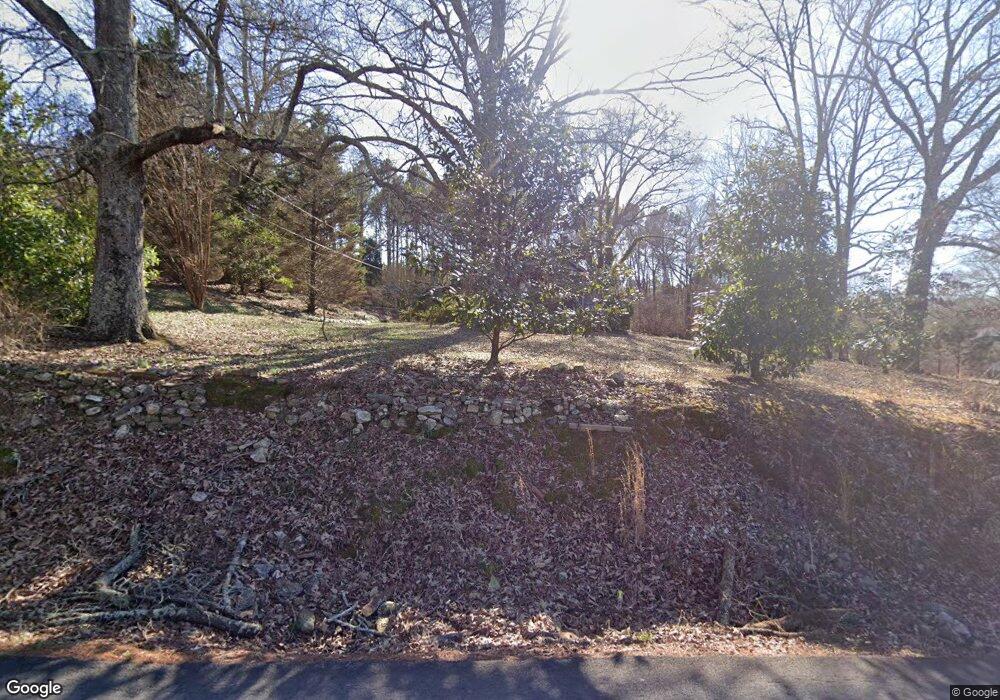
This home is located at 20 Sproull Rd SE, Rome, GA 30161 and is currently estimated at $169,331, approximately $153 per square foot. 20 Sproull Rd SE is a home located in Floyd County with nearby schools including Model Middle School and Model High School.
Ownership History
Date
Name
Owned For
Owner Type
Purchase Details
Closed on
Jul 12, 2007
Sold by
Not Provided
Bought by
Moore Stephen R
Current Estimated Value
Purchase Details
Closed on
Jul 25, 1995
Sold by
Shipp Gordon and Peggy Shipp
Bought by
Moore Stephen R
Purchase Details
Closed on
Nov 3, 1994
Bought by
P and R
Purchase Details
Closed on
Jan 17, 1986
Sold by
Phillips Benjamin R
Bought by
Shipp Gordon and Peggy Shipp
Purchase Details
Closed on
Aug 8, 1977
Sold by
Adm Of V A
Bought by
Phillips Benjamin R
Purchase Details
Closed on
Feb 2, 1977
Sold by
Astoria Fed S & L Assn
Bought by
Adm Of V A
Purchase Details
Closed on
Feb 1, 1977
Sold by
Milstead Gerald Lee
Bought by
Astoria Fed S & L Assn
Purchase Details
Closed on
Jan 25, 1973
Sold by
Terrell David
Bought by
Milstead Gerald Lee
Purchase Details
Closed on
Oct 14, 1972
Sold by
Quick Annie Maguerite
Bought by
Terrell David
Purchase Details
Closed on
Jan 1, 1958
Bought by
Quick Annie Maguerite
Create a Home Valuation Report for This Property
The Home Valuation Report is an in-depth analysis detailing your home's value as well as a comparison with similar homes in the area
Home Values in the Area
Average Home Value in this Area
Purchase History
| Date | Buyer | Sale Price | Title Company |
|---|---|---|---|
| Moore Stephen R | $1,500 | -- | |
| Moore Stephen R | $19,000 | -- | |
| P | -- | -- | |
| Shipp Gordon | $17,000 | -- | |
| Phillips Benjamin R | $10,500 | -- | |
| Adm Of V A | -- | -- | |
| Astoria Fed S & L Assn | $14,800 | -- | |
| Milstead Gerald Lee | $14,300 | -- | |
| Terrell David | $9,000 | -- | |
| Quick Annie Maguerite | -- | -- |
Source: Public Records
Tax History Compared to Growth
Tax History
| Year | Tax Paid | Tax Assessment Tax Assessment Total Assessment is a certain percentage of the fair market value that is determined by local assessors to be the total taxable value of land and additions on the property. | Land | Improvement |
|---|---|---|---|---|
| 2024 | $796 | $41,912 | $9,715 | $32,197 |
| 2023 | $717 | $35,968 | $8,832 | $27,136 |
| 2022 | $585 | $27,688 | $7,286 | $20,402 |
| 2021 | $480 | $21,439 | $6,632 | $14,807 |
| 2020 | $426 | $18,324 | $5,767 | $12,557 |
| 2019 | $407 | $17,497 | $5,767 | $11,730 |
| 2018 | $390 | $16,461 | $5,493 | $10,968 |
| 2017 | $373 | $15,554 | $5,086 | $10,468 |
| 2016 | $369 | $15,262 | $5,080 | $10,182 |
| 2015 | -- | $15,262 | $5,080 | $10,182 |
| 2014 | -- | $15,262 | $5,080 | $10,182 |
Source: Public Records
Map
Nearby Homes
- 158 Sproull Rd SE
- 0 Mountain Creek Dr SE Unit 10436191
- 30 Mountain Creek Dr SE
- 127 Branson Rd SE
- 1849 Morrison Camp Ground Rd NE
- 567 Fred Kelley Rd NE
- 7 Trimble Way SE
- 406 Fred Kelly Rd NE
- 21 Everwood Ct SE
- 818 Morrison Camp Ground Rd NE
- 12 Winterberry Ln SE
- 0 Fallen Branch Cir SE Unit 7397536
- 0 Fallen Branch Cir SE Unit 10311756
- 0 Fallen Branch Cir SE Unit 7234792
- 0 Fallen Branch Cir SE Unit 10172755
- 16 Fallen Branch Cir SE
- 1 Outpost Trail SE
- 3 Outpost Trail SE
- 139 Shoals Ferry Rd SE
- 0 N Quarters Dr Unit 7467468
- 3172 Kingston Hwy SE
- 28 Sproull Rd SE
- 0 Sproull Rd SE
- 0 Sproull Rd SE Unit 3228463
- 0 Sproull Rd SE Unit 3210032
- 0 Sproull Rd SE Unit 8498918
- 0 Sproull Rd SE Unit 7319749
- 0 Sproull Rd SE Unit 8049716
- 0 Sproull Rd SE Unit 8207562
- 3158 Kingston Hwy SE
- 14 Dykes Creek Church Rd NE
- 3130 Kingston Hwy SE
- 3138 Kingston Hwy SE
- 64 Sproull Rd SE
- 3108 Kingston Hwy SE
- 3237 Kingston Hwy NE
- 3219 Kingston Hwy NE
- 3098 Kingston Hwy SE
- 3181 Kingston Hwy NE
- 21 Meadows Dr SE