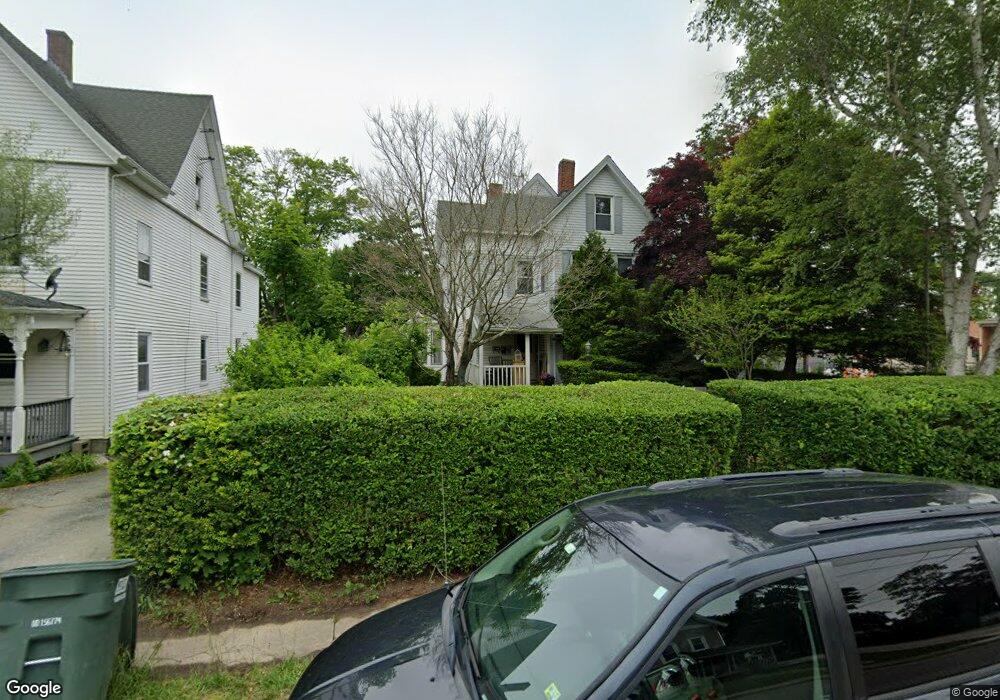
20 Spruce St Westerly, RI 02891
Estimated Value: $564,333 - $658,000
5
Beds
3
Baths
2,572
Sq Ft
$233/Sq Ft
Est. Value
About This Home
This home is located at 20 Spruce St, Westerly, RI 02891 and is currently estimated at $600,083, approximately $233 per square foot. 20 Spruce St is a home located in Washington County with nearby schools including Westerly High School and St. Michael School.
Ownership History
Date
Name
Owned For
Owner Type
Purchase Details
Closed on
Mar 15, 2023
Sold by
Westerly Town Of
Bought by
Harbor Heights Llc
Current Estimated Value
Purchase Details
Closed on
Mar 31, 1995
Sold by
Manfredi Anthony P
Bought by
Granados Arturo A
Home Financials for this Owner
Home Financials are based on the most recent Mortgage that was taken out on this home.
Original Mortgage
$112,000
Interest Rate
8.49%
Create a Home Valuation Report for This Property
The Home Valuation Report is an in-depth analysis detailing your home's value as well as a comparison with similar homes in the area
Home Values in the Area
Average Home Value in this Area
Purchase History
| Date | Buyer | Sale Price | Title Company |
|---|---|---|---|
| Harbor Heights Llc | $5,872 | None Available | |
| Harbor Heights Llc | $5,872 | None Available | |
| Harbor Heights Llc | $5,872 | None Available | |
| Granados Arturo A | $140,000 | -- | |
| Granados Arturo A | $140,000 | -- |
Source: Public Records
Mortgage History
| Date | Status | Borrower | Loan Amount |
|---|---|---|---|
| Previous Owner | Granados Arturo A | $20,000 | |
| Previous Owner | Granados Arturo A | $112,000 | |
| Previous Owner | Granados Arturo A | $112,000 |
Source: Public Records
Tax History
| Year | Tax Paid | Tax Assessment Tax Assessment Total Assessment is a certain percentage of the fair market value that is determined by local assessors to be the total taxable value of land and additions on the property. | Land | Improvement |
|---|---|---|---|---|
| 2025 | $3,494 | $449,100 | $160,700 | $288,400 |
| 2024 | $3,404 | $325,700 | $115,200 | $210,500 |
| 2023 | $3,309 | $325,700 | $115,200 | $210,500 |
| 2022 | $3,290 | $325,700 | $115,200 | $210,500 |
| 2021 | $3,388 | $280,900 | $100,300 | $180,600 |
| 2020 | $3,329 | $280,900 | $100,300 | $180,600 |
| 2019 | $3,298 | $280,900 | $100,300 | $180,600 |
| 2018 | $3,216 | $260,400 | $100,300 | $160,100 |
| 2017 | $3,125 | $260,400 | $100,300 | $160,100 |
| 2016 | $3,125 | $260,400 | $100,300 | $160,100 |
| 2015 | $2,919 | $259,900 | $102,300 | $157,600 |
| 2014 | $2,513 | $259,900 | $102,300 | $157,600 |
Source: Public Records
Map
Nearby Homes
Your Personal Tour Guide
Ask me questions while you tour the home.