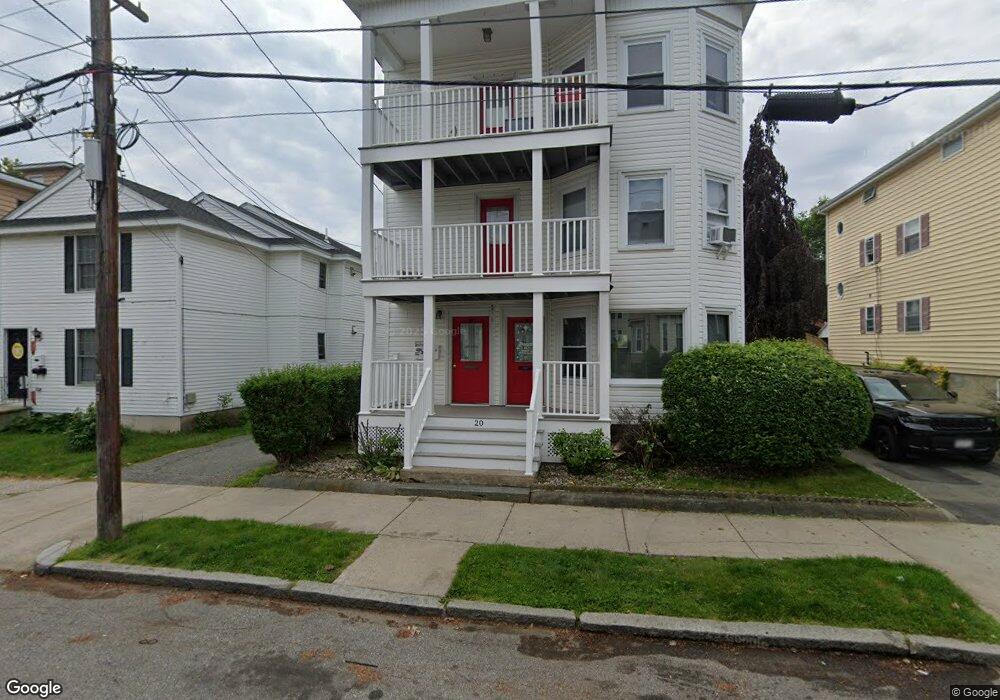
20 Stephen St Unit 3 Lynn, MA 01902
Diamond District NeighborhoodEstimated Value: $872,000 - $942,000
2
Beds
1
Bath
1,100
Sq Ft
$820/Sq Ft
Est. Value
About This Home
This home is located at 20 Stephen St Unit 3, Lynn, MA 01902 and is currently estimated at $901,667, approximately $819 per square foot. 20 Stephen St Unit 3 is a home located in Essex County with nearby schools including Brickett Elementary School, William R. Fallon School, and Marshall Middle School.
Ownership History
Date
Name
Owned For
Owner Type
Purchase Details
Closed on
Apr 29, 2021
Sold by
Mcgovern Thomas A
Bought by
Mcgovern Ft
Current Estimated Value
Purchase Details
Closed on
Jul 8, 2010
Sold by
Garcia Ricardo A
Bought by
Mcgovern Thomas A
Home Financials for this Owner
Home Financials are based on the most recent Mortgage that was taken out on this home.
Original Mortgage
$187,500
Interest Rate
4.78%
Mortgage Type
Purchase Money Mortgage
Purchase Details
Closed on
Feb 24, 2010
Sold by
Miller April and Mers
Bought by
Wachovia Bk
Purchase Details
Closed on
Jun 1, 2007
Sold by
Dwan Daryl
Bought by
Miller Peter
Purchase Details
Closed on
Mar 24, 1998
Sold by
Acadian Rt Inc
Bought by
Dwan Daryl
Create a Home Valuation Report for This Property
The Home Valuation Report is an in-depth analysis detailing your home's value as well as a comparison with similar homes in the area
Home Values in the Area
Average Home Value in this Area
Purchase History
| Date | Buyer | Sale Price | Title Company |
|---|---|---|---|
| Mcgovern Ft | -- | None Available | |
| Mcgovern Ft | -- | None Available | |
| Mcgovern Ft | -- | None Available | |
| Mcgovern Thomas A | $250,000 | -- | |
| Mcgovern Thomas A | $250,000 | -- | |
| Wachovia Bk | $185,000 | -- | |
| Wachovia Bk | $185,000 | -- | |
| Miller Peter | $450,000 | -- | |
| Miller Peter | $450,000 | -- | |
| Dwan Daryl | $137,500 | -- | |
| Dwan Daryl | $137,500 | -- |
Source: Public Records
Mortgage History
| Date | Status | Borrower | Loan Amount |
|---|---|---|---|
| Previous Owner | Dwan Daryl | $196,000 | |
| Previous Owner | Dwan Daryl | $187,500 |
Source: Public Records
Tax History
| Year | Tax Paid | Tax Assessment Tax Assessment Total Assessment is a certain percentage of the fair market value that is determined by local assessors to be the total taxable value of land and additions on the property. | Land | Improvement |
|---|---|---|---|---|
| 2025 | $8,586 | $828,800 | $187,500 | $641,300 |
| 2024 | $8,570 | $813,900 | $179,400 | $634,500 |
| 2023 | $8,457 | $758,500 | $191,800 | $566,700 |
| 2022 | $8,164 | $656,800 | $149,800 | $507,000 |
| 2021 | $7,617 | $584,600 | $122,700 | $461,900 |
| 2020 | $7,383 | $551,000 | $126,200 | $424,800 |
| 2019 | $6,895 | $482,200 | $97,400 | $384,800 |
| 2018 | $6,610 | $436,300 | $109,400 | $326,900 |
| 2017 | $6,334 | $406,000 | $96,100 | $309,900 |
| 2016 | $5,779 | $357,200 | $80,300 | $276,900 |
| 2015 | $5,394 | $322,000 | $85,000 | $237,000 |
Source: Public Records
Map
Nearby Homes
- 185 Lewis St Unit 4
- 11 Seymour Ave Unit 3
- 7 Sidney Ave
- 12 Howard St
- 6 Nichols St
- 133 Chestnut St
- 13 Portland St Unit 4
- 97 Seymour Ave
- 129 Williams Ave
- 79 Brookline St
- 238 Essex St
- 106 Williams Ave
- 14-16 Dexter St
- 13 Nahant St Unit 2D
- 13 Nahant St Unit 3A
- 13 Nahant St Unit 4C
- 13 Nahant St Unit 4B
- 45 School St
- 285 Lynn Shore Dr Unit 508
- 285 Lynn Shore Dr Unit 205
- 20 Stephen St
- 18 Stephen St
- 24 Stephen St Unit 1
- 29 Kenwood Terrace
- 10 Stephen St Unit 5
- 10 Stephen St Unit 6
- 10 Stephen St Unit 3
- 10 Stephen St Unit 4
- 10 Stephen St Unit 1
- 10-16 Stephen St Unit 1
- 28 Stephen St
- 28 Kenwood Terrace
- 13 Stephen St
- 13 Stephen St Unit 1
- 13 Stephen St Unit 2
- 27 Beyer Place
- 17 Stephen St
- 6 Stephen St
- 6 Stephen St Unit 2
- 9 Stephen St
Your Personal Tour Guide
Ask me questions while you tour the home.