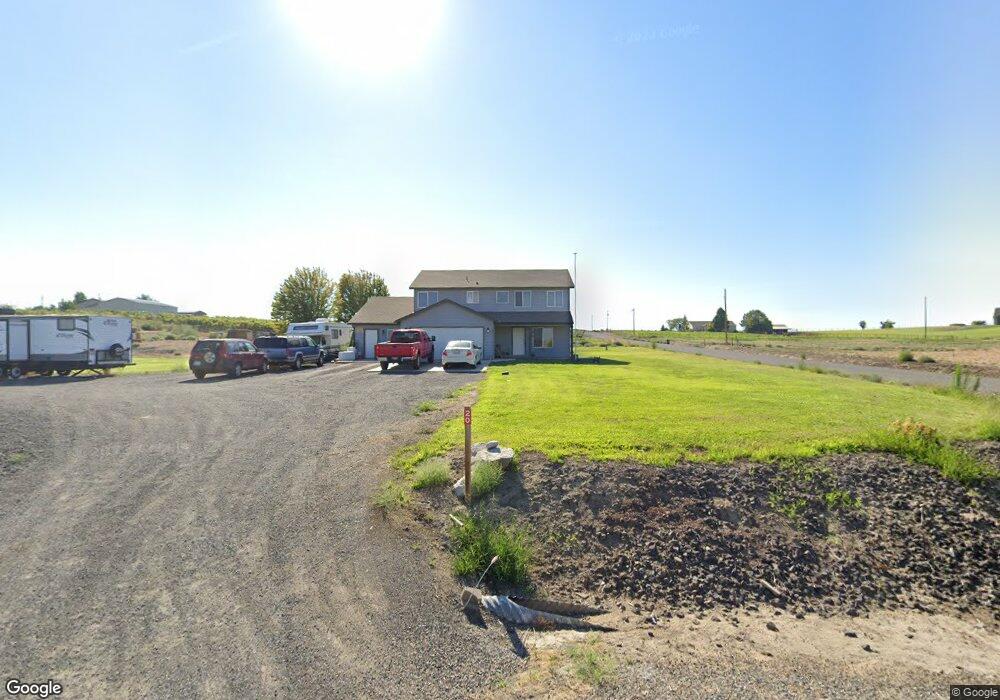
20 Summit Loop Eltopia, WA 99330
Estimated Value: $464,000 - $716,000
4
Beds
3
Baths
2,271
Sq Ft
$254/Sq Ft
Est. Value
About This Home
This home is located at 20 Summit Loop, Eltopia, WA 99330 and is currently estimated at $576,427, approximately $253 per square foot. 20 Summit Loop is a home located in Franklin County with nearby schools including Connell High School.
Ownership History
Date
Name
Owned For
Owner Type
Purchase Details
Closed on
May 11, 2012
Sold by
Fangman Serena L
Bought by
Fangman Brad D
Current Estimated Value
Home Financials for this Owner
Home Financials are based on the most recent Mortgage that was taken out on this home.
Original Mortgage
$226,827
Outstanding Balance
$157,452
Interest Rate
3.94%
Mortgage Type
New Conventional
Estimated Equity
$418,975
Purchase Details
Closed on
Nov 5, 2009
Sold by
Brent & Sheryl Llc
Bought by
Olin Homes Llc
Home Financials for this Owner
Home Financials are based on the most recent Mortgage that was taken out on this home.
Original Mortgage
$226,137
Interest Rate
5.02%
Mortgage Type
New Conventional
Purchase Details
Closed on
Nov 4, 2009
Sold by
Olin Homes Llc
Bought by
Fangman Brad D and Fangman Serena L
Home Financials for this Owner
Home Financials are based on the most recent Mortgage that was taken out on this home.
Original Mortgage
$226,137
Interest Rate
5.02%
Mortgage Type
New Conventional
Create a Home Valuation Report for This Property
The Home Valuation Report is an in-depth analysis detailing your home's value as well as a comparison with similar homes in the area
Purchase History
| Date | Buyer | Sale Price | Title Company |
|---|---|---|---|
| Fangman Brad D | -- | Stewart Title | |
| Olin Homes Llc | $55,000 | Benton Franklin Title | |
| Fangman Brad D | $221,615 | Benton Franklin Title |
Source: Public Records
Mortgage History
| Date | Status | Borrower | Loan Amount |
|---|---|---|---|
| Open | Fangman Brad D | $226,827 | |
| Closed | Fangman Brad D | $226,137 |
Source: Public Records
Tax History
| Year | Tax Paid | Tax Assessment Tax Assessment Total Assessment is a certain percentage of the fair market value that is determined by local assessors to be the total taxable value of land and additions on the property. | Land | Improvement |
|---|---|---|---|---|
| 2025 | $2,816 | $379,500 | $119,400 | $260,100 |
| 2023 | $2,656 | $379,500 | $119,400 | $260,100 |
| 2022 | $2,103 | $244,100 | $67,500 | $176,600 |
| 2021 | $2,484 | $270,000 | $65,000 | $205,000 |
| 2019 | $2,105 | $242,900 | $55,000 | $187,900 |
| 2018 | $2,421 | $241,700 | $50,000 | $191,700 |
| 2017 | $2,132 | $231,600 | $50,000 | $181,600 |
| 2015 | $2,262 | $221,000 | $50,000 | $171,000 |
| 2013 | -- | $212,900 | $50,000 | $162,900 |
Source: Public Records
Map
Nearby Homes
- 301 Summit Loop
- 508 Hill Dr
- 110 Tacoma Ave
- TBD Quinto Rd
- Nka N Bellevue Rd
- 0 N
- NKA Ringold Rd
- 4902 Fir Rd
- NKA Road 100
- tbd Broadmoor Blvd
- Lot 12 the Reach at River Ranch
- TBD N Commercial Ave
- NKA N Columbia River Rd
- 4221 Dogwood Rd
- 7 Selph Landing Rd
- 5 Selph Landing Rd
- 10 Selph Landing Rd
- 6 Selph Landing Rd
- 3 Selph Landing Rd
- 11 Selph Landing Rd
- 2 Summit Loop
- 11 Summit Loop
- 41 Summit Loop
- 71 Summit Loop
- 450 Summit Loop
- 111 Summit Loop
- 461 Summit Loop Unit Wide Open Spaces Awa
- 120 School Rd
- 300 Hill Dr Unit 13 miles north of Pa
- 300 Hill Dr Unit 2.6 Acre Ranchette W
- 300 Hill Dr
- 120 Summit Loop
- 140 Hill Dr
- 400 Summit Loop
- 400 Summit Loop Unit 2.94 ACRES!!
- 51 Spur Ct
- 360 Hill Dr
- Lot 7 Private Rd
- Lot 5 Private Rd
- Lot 6 Private Rd
Your Personal Tour Guide
Ask me questions while you tour the home.