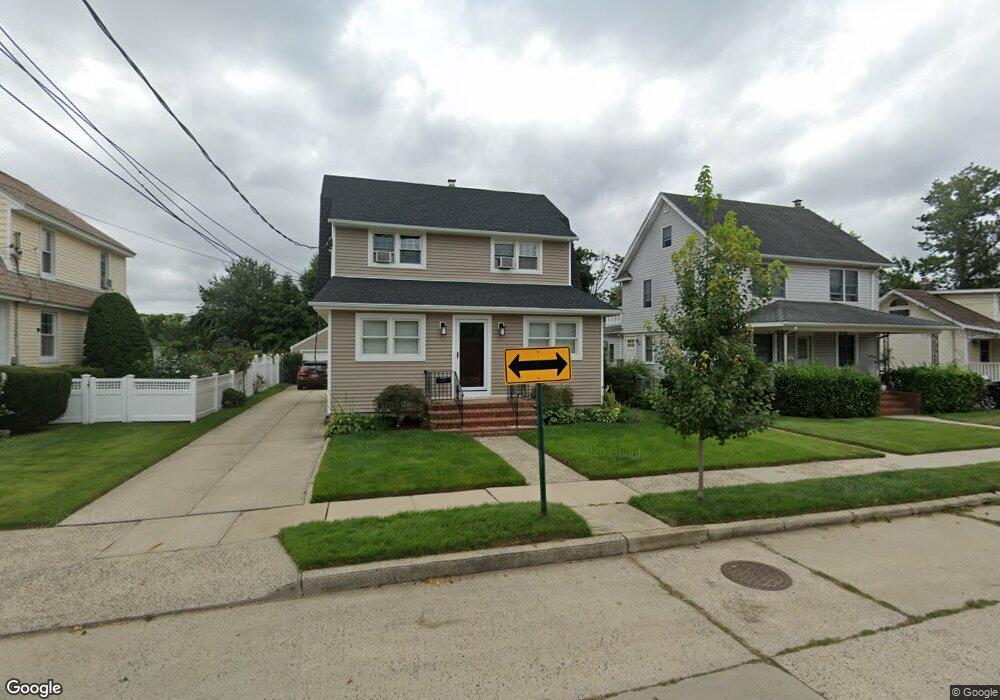
20 Sylvester Place Unit Main Lynbrook, NY 11563
Estimated Value: $787,000 - $800,124
2
Beds
1
Bath
1,762
Sq Ft
$450/Sq Ft
Est. Value
About This Home
This home is located at 20 Sylvester Place Unit Main, Lynbrook, NY 11563 and is currently estimated at $793,562, approximately $450 per square foot. 20 Sylvester Place Unit Main is a home located in Nassau County with nearby schools including Lynbrook Senior High School, Our Lady Of Peace School, and Valley Stream Christian Academy.
Ownership History
Date
Name
Owned For
Owner Type
Purchase Details
Closed on
Sep 2, 2022
Sold by
Pajak Krzysztof and Pajak Malgorzata
Bought by
Kassim Imran and Wong Crystal
Current Estimated Value
Home Financials for this Owner
Home Financials are based on the most recent Mortgage that was taken out on this home.
Original Mortgage
$671,500
Outstanding Balance
$640,003
Interest Rate
5.3%
Mortgage Type
New Conventional
Estimated Equity
$153,559
Purchase Details
Closed on
Dec 14, 2015
Sold by
Feltkamp Bruce and Feltkamp Douglas
Bought by
Pajak Krzysztof and Pajak Malgarzota
Home Financials for this Owner
Home Financials are based on the most recent Mortgage that was taken out on this home.
Original Mortgage
$403,750
Interest Rate
3.99%
Mortgage Type
New Conventional
Purchase Details
Closed on
Jul 7, 2008
Sold by
Lucarelli Rose
Bought by
Feltkamp Douglas
Purchase Details
Closed on
Sep 16, 1996
Create a Home Valuation Report for This Property
The Home Valuation Report is an in-depth analysis detailing your home's value as well as a comparison with similar homes in the area
Home Values in the Area
Average Home Value in this Area
Purchase History
| Date | Buyer | Sale Price | Title Company |
|---|---|---|---|
| Kassim Imran | $790,000 | First American Title Ins Co | |
| Kassim Imran | $790,000 | First American Title Ins Co | |
| Kassim Imran | $790,000 | First American Title Ins Co | |
| Pajak Krzysztof | $475,000 | None Available | |
| Feltkamp Douglas | $410,000 | -- | |
| Feltkamp Douglas | $410,000 | -- | |
| -- | -- | -- | |
| -- | -- | -- |
Source: Public Records
Mortgage History
| Date | Status | Borrower | Loan Amount |
|---|---|---|---|
| Open | Kassim Imran | $671,500 | |
| Closed | Kassim Imran | $671,500 | |
| Previous Owner | Pajak Krzysztof | $403,750 |
Source: Public Records
Tax History Compared to Growth
Tax History
| Year | Tax Paid | Tax Assessment Tax Assessment Total Assessment is a certain percentage of the fair market value that is determined by local assessors to be the total taxable value of land and additions on the property. | Land | Improvement |
|---|---|---|---|---|
| 2025 | $11,259 | $488 | $194 | $294 |
| 2024 | $1,034 | $488 | $194 | $294 |
| 2023 | $10,740 | $517 | $227 | $290 |
| 2022 | $10,740 | $488 | $194 | $294 |
| 2021 | $9,066 | $488 | $194 | $294 |
| 2020 | $10,306 | $666 | $513 | $153 |
| 2019 | $1,120 | $714 | $528 | $186 |
| 2018 | $1,141 | $744 | $0 | $0 |
| 2017 | $8,355 | $744 | $447 | $297 |
| 2016 | $9,431 | $744 | $447 | $297 |
| 2015 | $1,359 | $915 | $550 | $365 |
| 2014 | $1,359 | $915 | $550 | $365 |
| 2013 | $1,246 | $915 | $550 | $365 |
Source: Public Records
Map
Nearby Homes
- 232 Sherman St
- 504 Merrick Rd Unit 4J
- 504 Merrick Rd Unit 4E
- 504 Merrick Rd Unit 2k
- 57 Nieman Ave
- 67 Burtis St
- 33 Marshall Ave
- 60 Harvard Ave
- 59 Wood St
- 47 Wood St
- 11 Wood St
- 127 Smith St
- 29 Summit Ave
- 103 Smith St Unit 1
- 241 Hendrickson Ave
- 181 Walnut St
- 2 Fowler Ave Unit 206
- 2 Fowler Ave Unit 228
- 20 Daley Place Unit 128
- 30 Daley Place Unit 247
- 20 Sylvester Place
- 20 Sylvester Place Unit Upper
- 16 Sylvester Place
- 24 Sylvester Place
- 12 Sylvester Place
- 28 Sylvester Place
- 1 Clark Ave
- 8 Sylvester Place
- 2 Clark Ave
- 34 Harding Ave
- 40 Harding Ave
- 32 Harding Ave
- 8 Clark Ave
- 4 Sylvester Place
- 226 Sherman St
- 44 Harding Ave
- 5 Sylvester Place
- 216 Sherman St
- 48 Harding Ave
- 208 Sherman St