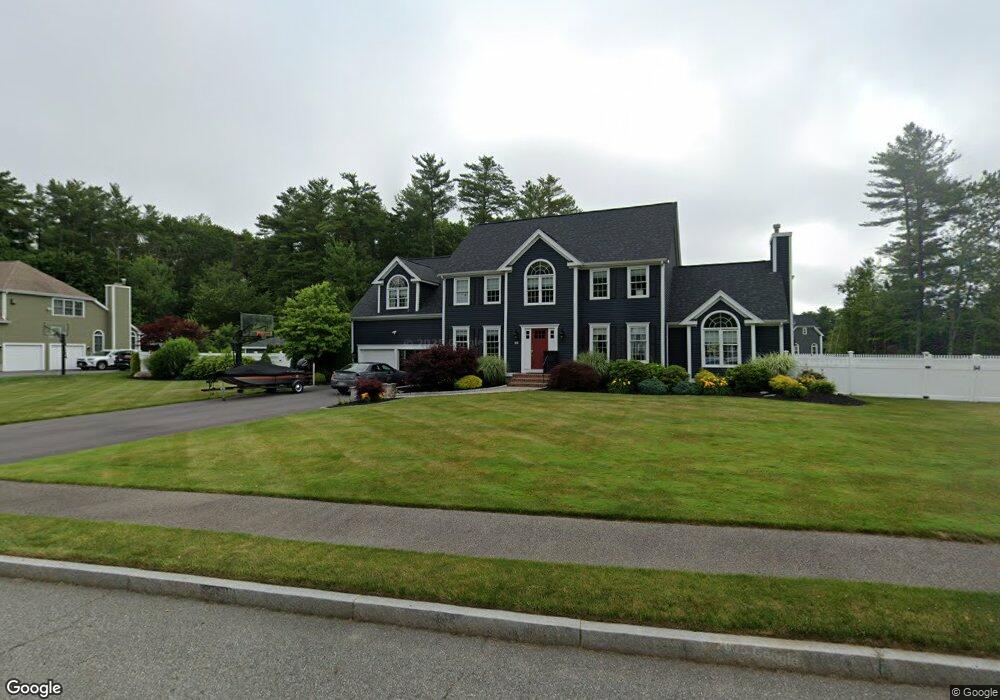
20 Symphony Dr North Easton, MA 02356
Estimated Value: $1,168,144 - $1,355,000
4
Beds
4
Baths
3,125
Sq Ft
$403/Sq Ft
Est. Value
About This Home
This home is located at 20 Symphony Dr, North Easton, MA 02356 and is currently estimated at $1,260,036, approximately $403 per square foot. 20 Symphony Dr is a home located in Bristol County with nearby schools including Easton Middle School.
Ownership History
Date
Name
Owned For
Owner Type
Purchase Details
Closed on
Jan 21, 2022
Sold by
Flanagan Peter L
Bought by
Symphony Dr Nt and Flanagan
Current Estimated Value
Purchase Details
Closed on
Oct 9, 2015
Sold by
Flanagan Ft and Flanagan
Bought by
Flanagan Peter L
Purchase Details
Closed on
Nov 10, 2004
Sold by
Flanagan Peter L and Flanagan Robin A
Bought by
Flanagan Ft and Flanagan
Create a Home Valuation Report for This Property
The Home Valuation Report is an in-depth analysis detailing your home's value as well as a comparison with similar homes in the area
Home Values in the Area
Average Home Value in this Area
Purchase History
| Date | Buyer | Sale Price | Title Company |
|---|---|---|---|
| Symphony Dr Nt | -- | None Available | |
| Symphony Dr Nt | -- | None Available | |
| Flanagan Peter L | -- | -- | |
| Flanagan Peter L | -- | -- | |
| Flanagan Ft | -- | -- | |
| Flanagan Ft | -- | -- |
Source: Public Records
Mortgage History
| Date | Status | Borrower | Loan Amount |
|---|---|---|---|
| Previous Owner | Flanagan Ft | $335,000 | |
| Previous Owner | Flanagan Ft | $377,000 | |
| Previous Owner | Flanagan Ft | $275,000 |
Source: Public Records
Tax History Compared to Growth
Tax History
| Year | Tax Paid | Tax Assessment Tax Assessment Total Assessment is a certain percentage of the fair market value that is determined by local assessors to be the total taxable value of land and additions on the property. | Land | Improvement |
|---|---|---|---|---|
| 2025 | $13,993 | $1,121,200 | $460,200 | $661,000 |
| 2024 | $14,096 | $1,055,900 | $405,800 | $650,100 |
| 2023 | $13,376 | $916,800 | $389,500 | $527,300 |
| 2022 | $12,629 | $820,600 | $312,600 | $508,000 |
| 2021 | $12,170 | $786,200 | $278,200 | $508,000 |
| 2020 | $11,869 | $771,700 | $278,200 | $493,500 |
| 2019 | $12,106 | $758,500 | $278,200 | $480,300 |
| 2018 | $11,931 | $736,000 | $285,600 | $450,400 |
| 2017 | $11,451 | $706,000 | $285,600 | $420,400 |
| 2016 | $11,147 | $688,500 | $288,100 | $400,400 |
| 2015 | $10,362 | $617,500 | $233,400 | $384,100 |
| 2014 | $10,305 | $618,900 | $239,600 | $379,300 |
Source: Public Records
Map
Nearby Homes
- 23 Tanglewood Dr
- 416 Foundry St
- 441 Foundry St
- 431 Depot St - L4 Overlook Ln
- 10 Matthew Cir
- 64 South St
- 531 Foundry St Unit E
- 531 Foundry St Unit D
- 531 Foundry St Unit A
- 531 Foundry St Unit C
- 17 Gaslight Ln
- 1 Newell Cir
- 2 Ford Cir
- 20 Coach Rd
- 3 Coach Rd
- 23 Cutter Dr
- 555 Foundry St Unit B
- Starling Plan at Sawmill Village
- Mallard Plan at Sawmill Village
- Goldfinch Plan at Sawmill Village