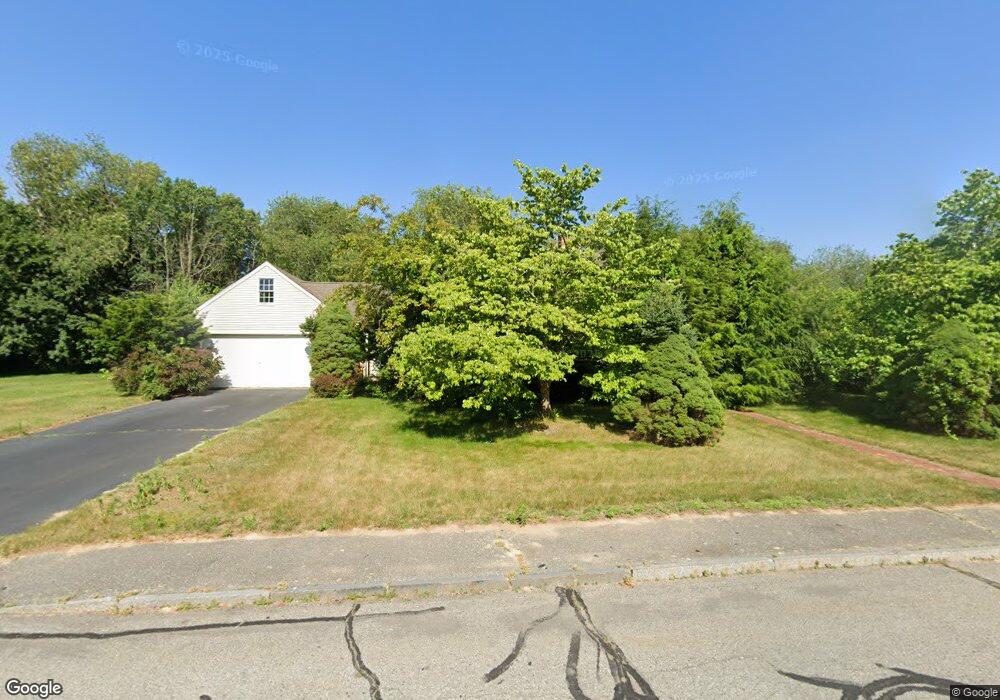
20 Tabway Ln Bridgewater, MA 02324
Estimated Value: $850,000 - $996,000
3
Beds
3
Baths
3,123
Sq Ft
$291/Sq Ft
Est. Value
About This Home
This home is located at 20 Tabway Ln, Bridgewater, MA 02324 and is currently estimated at $909,430, approximately $291 per square foot. 20 Tabway Ln is a home located in Plymouth County with nearby schools including Mitchell Elementary School, Williams Intermediate School, and Bridgewater Middle School.
Ownership History
Date
Name
Owned For
Owner Type
Purchase Details
Closed on
Mar 1, 2017
Sold by
Upchurch Brent
Bought by
Brent H Upchurch Ret
Current Estimated Value
Purchase Details
Closed on
Jun 23, 1994
Sold by
Haag Leif and Haag Marianne
Bought by
Upchurch Brent
Purchase Details
Closed on
Jun 16, 1993
Sold by
Lee Robert J and Lee Nancy A
Bought by
Haag Leif and Haag Marianne
Purchase Details
Closed on
Jul 6, 1989
Sold by
Mather Michael C
Bought by
Lee Robert J
Create a Home Valuation Report for This Property
The Home Valuation Report is an in-depth analysis detailing your home's value as well as a comparison with similar homes in the area
Home Values in the Area
Average Home Value in this Area
Purchase History
| Date | Buyer | Sale Price | Title Company |
|---|---|---|---|
| Brent H Upchurch Ret | -- | -- | |
| Upchurch Brent | $240,000 | -- | |
| Haag Leif | $240,000 | -- | |
| Lee Robert J | $280,000 | -- |
Source: Public Records
Mortgage History
| Date | Status | Borrower | Loan Amount |
|---|---|---|---|
| Previous Owner | Lee Robert J | $100,000 | |
| Previous Owner | Lee Robert J | $202,000 | |
| Previous Owner | Lee Robert J | $177,760 |
Source: Public Records
Tax History Compared to Growth
Tax History
| Year | Tax Paid | Tax Assessment Tax Assessment Total Assessment is a certain percentage of the fair market value that is determined by local assessors to be the total taxable value of land and additions on the property. | Land | Improvement |
|---|---|---|---|---|
| 2025 | $9,715 | $821,200 | $237,800 | $583,400 |
| 2024 | $9,519 | $784,100 | $226,400 | $557,700 |
| 2023 | $9,416 | $733,300 | $211,600 | $521,700 |
| 2022 | $9,305 | $649,800 | $185,600 | $464,200 |
| 2021 | $10,045 | $605,300 | $165,700 | $439,600 |
| 2020 | $8,654 | $587,500 | $159,300 | $428,200 |
| 2019 | $7,273 | $572,400 | $159,300 | $413,100 |
| 2018 | $8,514 | $560,500 | $161,200 | $399,300 |
| 2017 | $9,492 | $522,200 | $161,200 | $361,000 |
| 2016 | $7,767 | $499,800 | $158,000 | $341,800 |
| 2015 | $7,797 | $480,100 | $153,400 | $326,700 |
| 2014 | $7,732 | $475,800 | $154,800 | $321,000 |
Source: Public Records
Map
Nearby Homes
- 1442 Old Pleasant St
- 357 Vernon St
- 74 Vernon St
- 1570 Old Pleasant St
- 88 Boxwood Ln
- 54 Grange Park
- 29 Saddle Dr
- 165 Grange Park
- 25 Twin Diamond Dr
- 8 North St
- 35 Stockbridge Rd
- 40 Country Club Dr
- 905 Vernon St
- 50 Stephanie Ln
- 331 North St
- Lot 2 Fontana Way
- 10 College Rd
- 1075 South St
- 115 Cross St
- 5 Jaclyn Way