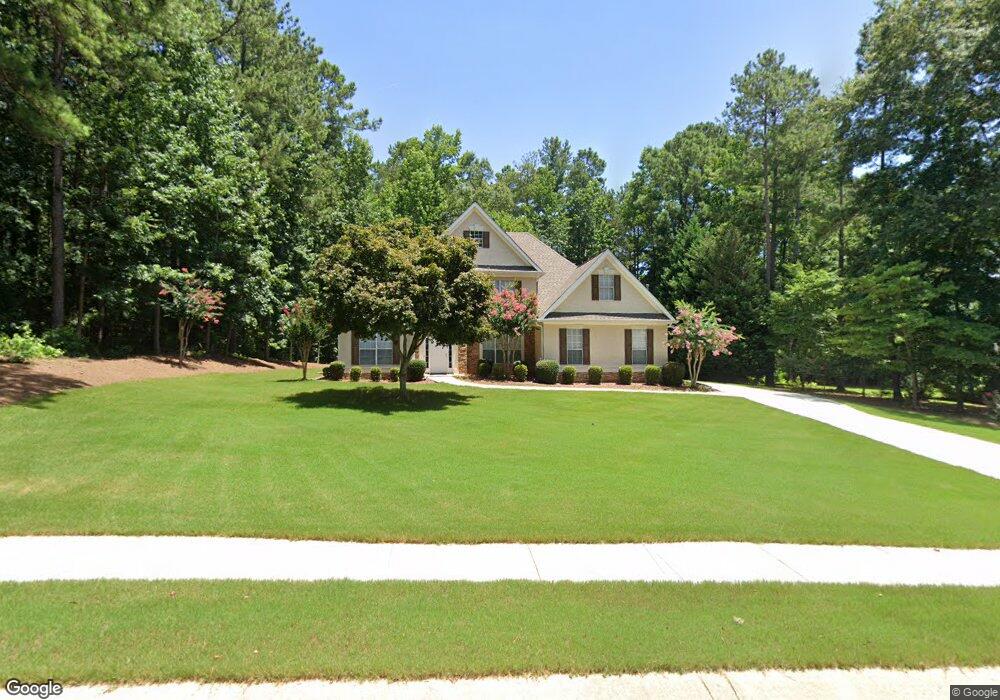
20 Tanqueray St Sharpsburg, GA 30277
Estimated Value: $462,437 - $555,000
4
Beds
3
Baths
2,606
Sq Ft
$194/Sq Ft
Est. Value
About This Home
This home is located at 20 Tanqueray St, Sharpsburg, GA 30277 and is currently estimated at $505,359, approximately $193 per square foot. 20 Tanqueray St is a home located in Coweta County with nearby schools including Canongate Elementary School, Madras Middle School, and Northgate High School.
Ownership History
Date
Name
Owned For
Owner Type
Purchase Details
Closed on
Jul 16, 2020
Sold by
Harris Donald B
Bought by
Cobb Bryan Fulton and Cobb Shawn Renee
Current Estimated Value
Home Financials for this Owner
Home Financials are based on the most recent Mortgage that was taken out on this home.
Original Mortgage
$327,750
Outstanding Balance
$289,978
Interest Rate
3.1%
Mortgage Type
New Conventional
Estimated Equity
$215,381
Purchase Details
Closed on
Feb 26, 1999
Sold by
Carrington Home Inc
Bought by
Harris Donald B and Harris Pamela K
Home Financials for this Owner
Home Financials are based on the most recent Mortgage that was taken out on this home.
Original Mortgage
$100,000
Interest Rate
6.73%
Mortgage Type
New Conventional
Purchase Details
Closed on
Feb 28, 1998
Bought by
Carrington Homes Inc
Purchase Details
Closed on
Nov 23, 1992
Bought by
Frenchy Community De
Purchase Details
Closed on
Feb 20, 1973
Bought by
Glass Lamar F Dr Et
Create a Home Valuation Report for This Property
The Home Valuation Report is an in-depth analysis detailing your home's value as well as a comparison with similar homes in the area
Home Values in the Area
Average Home Value in this Area
Purchase History
| Date | Buyer | Sale Price | Title Company |
|---|---|---|---|
| Cobb Bryan Fulton | $345,000 | -- | |
| Harris Donald B | $187,000 | -- | |
| Carrington Homes Inc | $26,700 | -- | |
| Frenchy Community De | $1,185,900 | -- | |
| Glass Lamar F Dr Et | $123,600 | -- |
Source: Public Records
Mortgage History
| Date | Status | Borrower | Loan Amount |
|---|---|---|---|
| Open | Cobb Bryan Fulton | $327,750 | |
| Previous Owner | Harris Donald B | $100,000 |
Source: Public Records
Tax History Compared to Growth
Tax History
| Year | Tax Paid | Tax Assessment Tax Assessment Total Assessment is a certain percentage of the fair market value that is determined by local assessors to be the total taxable value of land and additions on the property. | Land | Improvement |
|---|---|---|---|---|
| 2025 | $4,457 | $198,336 | $32,000 | $166,336 |
| 2024 | $4,106 | $179,386 | $32,000 | $147,386 |
| 2023 | $4,106 | $172,589 | $32,000 | $140,589 |
| 2022 | $3,809 | $157,370 | $32,000 | $125,370 |
| 2021 | $2,985 | $116,248 | $20,000 | $96,248 |
| 2020 | $2,000 | $116,248 | $20,000 | $96,248 |
| 2019 | $2,896 | $102,094 | $20,000 | $82,094 |
| 2018 | $2,901 | $102,094 | $20,000 | $82,094 |
| 2017 | $2,708 | $95,527 | $20,000 | $75,527 |
| 2016 | $2,678 | $95,527 | $20,000 | $75,527 |
| 2015 | $2,412 | $87,646 | $20,000 | $67,646 |
| 2014 | $2,099 | $77,138 | $20,000 | $57,138 |
Source: Public Records
Map
Nearby Homes
- 28 Border Point
- 110 Kylemore Pass
- 104 Ashland Trail
- 150 Kylemore Pass
- 100 Ashland Trail
- 100 Clydesdale Ct
- 200 Chaparral Trace
- 575 Laurelwood Dr
- 20 Skipton Ct
- 2185 Castle Lake Dr
- 135 Crimson Ridge
- 9 Warrior Way
- 11 Line Creek Cir
- 121 Northwoods Rd
- 70 N Strathmore Dr
- 40 Wenham Ln
- 259 Strathmore Dr Unit 3
- 475 Castlewood Rd
- 35 Palmer Place
- 240 Lynnwood Ave
- 30 Tanqueray St
- 350 French Village Blvd
- 338 French Village Blvd
- 55 Bellview Ridge
- 65 Bellview Ridge
- 40 Tanqueray St
- 25 Tanqueray St
- 25 Bellview Ridge
- 11 Bellview Ridge
- 75 Bellview Ridge
- 35 Tanqueray St
- 5 Tanqueray St
- 5 Tanqueray St Unit B-74
- 0 Bellview Ridge Unit 8620629
- 0 Bellview Ridge Unit 8616177
- 0 Bellview Ridge Unit 8726378
- 0 Bellview Ridge Unit 8691646
- 0 Bellview Ridge Unit 8747443
- 0 Bellview Ridge Unit 8762072
- 0 Bellview Ridge Unit 8783990