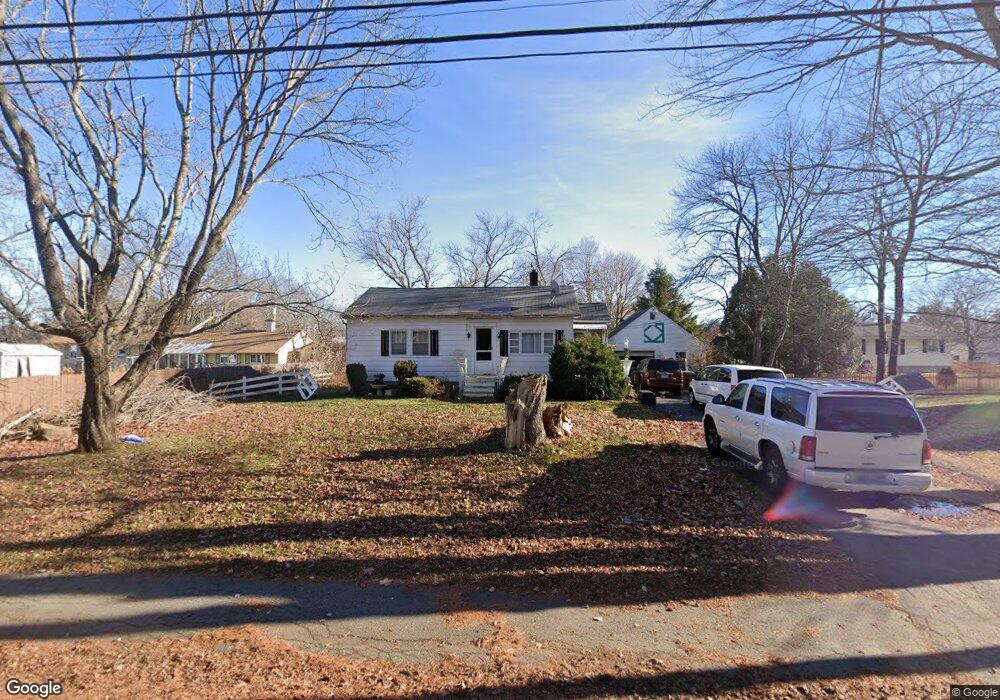
20 Tasker St Saco, ME 04072
Central Saco NeighborhoodEstimated Value: $384,000 - $665,000
4
Beds
2
Baths
924
Sq Ft
$498/Sq Ft
Est. Value
About This Home
This home is located at 20 Tasker St, Saco, ME 04072 and is currently estimated at $459,748, approximately $497 per square foot. 20 Tasker St is a home located in York County with nearby schools including C K Burns School, Saco Middle School, and Saint James School.
Ownership History
Date
Name
Owned For
Owner Type
Purchase Details
Closed on
Oct 30, 2017
Sold by
Estrella Chantel L and Bergeron William S
Bought by
Dube Michelle G
Current Estimated Value
Home Financials for this Owner
Home Financials are based on the most recent Mortgage that was taken out on this home.
Original Mortgage
$246,935
Outstanding Balance
$206,536
Interest Rate
3.78%
Mortgage Type
New Conventional
Estimated Equity
$253,212
Purchase Details
Closed on
Sep 14, 2015
Sold by
Deletesky Seth M and Deletesky Alyson M
Bought by
Estrella Chantel L and Bergeon William
Home Financials for this Owner
Home Financials are based on the most recent Mortgage that was taken out on this home.
Original Mortgage
$310,500
Interest Rate
4.01%
Mortgage Type
New Conventional
Purchase Details
Closed on
Feb 16, 2012
Sold by
Eugene F Bloodgood Est
Bought by
Perreault Deborah J
Purchase Details
Closed on
May 19, 2011
Sold by
Deletetsky Patricia C and Deletetsky Peter D
Bought by
Deletetsky Alyson M and Deletetsky Seth M
Create a Home Valuation Report for This Property
The Home Valuation Report is an in-depth analysis detailing your home's value as well as a comparison with similar homes in the area
Home Values in the Area
Average Home Value in this Area
Purchase History
| Date | Buyer | Sale Price | Title Company |
|---|---|---|---|
| Dube Michelle G | -- | -- | |
| Estrella Chantel L | -- | -- | |
| Perreault Deborah J | -- | -- | |
| Deletetsky Alyson M | -- | -- |
Source: Public Records
Mortgage History
| Date | Status | Borrower | Loan Amount |
|---|---|---|---|
| Open | Dube Michelle G | $246,935 | |
| Previous Owner | Estrella Chantel L | $310,500 |
Source: Public Records
Tax History
| Year | Tax Paid | Tax Assessment Tax Assessment Total Assessment is a certain percentage of the fair market value that is determined by local assessors to be the total taxable value of land and additions on the property. | Land | Improvement |
|---|---|---|---|---|
| 2024 | $3,317 | $236,100 | $123,200 | $112,900 |
| 2023 | $3,482 | $236,100 | $123,200 | $112,900 |
| 2022 | $3,202 | $174,700 | $93,900 | $80,800 |
| 2021 | $3,047 | $161,400 | $83,800 | $77,600 |
| 2020 | $2,870 | $145,900 | $73,900 | $72,000 |
| 2019 | $2,828 | $145,900 | $73,900 | $72,000 |
| 2018 | $2,696 | $139,100 | $67,100 | $72,000 |
| 2017 | $2,680 | $138,300 | $67,100 | $71,200 |
| 2016 | $2,808 | $144,600 | $63,100 | $81,500 |
| 2015 | $2,748 | $143,000 | $62,400 | $80,600 |
| 2014 | $2,663 | $143,000 | $62,400 | $80,600 |
| 2013 | $2,657 | $143,000 | $62,400 | $80,600 |
Source: Public Records
Map
Nearby Homes
- 5 Brentwood Cir
- 22 Tasker St Unit 11
- 7 Pleasant View Dr
- 34 Pepperell St
- 27 Pepperell St Unit 1
- 224 North St Unit 105
- 8 Oakland St
- 6 Lina Ave
- 7 Hubbard St
- TBD Oakland St
- 24 Dyer St
- 9 Nottingham Dr
- 5 Blaine St Unit 101
- 5 Blaine St Unit 104
- 5 Blaine St Unit 102
- 5 Blaine St
- 5 Blaine St Unit 113
- 5 Blaine St Unit 103
- 5 Blaine St Unit 100
- 5 Blaine St Unit 110
Your Personal Tour Guide
Ask me questions while you tour the home.