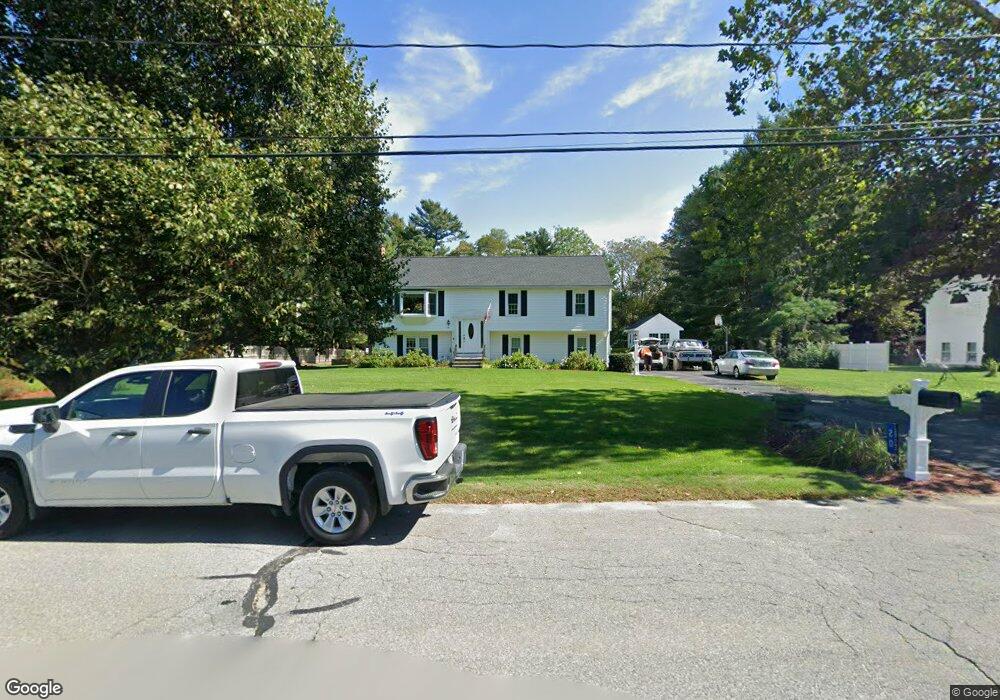
20 Thomas Rd Berkley, MA 02779
Berkley Bridge/Lower Berkley NeighborhoodEstimated Value: $542,805 - $631,000
3
Beds
2
Baths
1,220
Sq Ft
$468/Sq Ft
Est. Value
About This Home
This home is located at 20 Thomas Rd, Berkley, MA 02779 and is currently estimated at $571,451, approximately $468 per square foot. 20 Thomas Rd is a home located in Bristol County with nearby schools including Berkley Community School.
Ownership History
Date
Name
Owned For
Owner Type
Purchase Details
Closed on
Jun 27, 2000
Sold by
Department Of Housing & Urban Dev
Bought by
Macomber Jeffrey S and Macomber Tracie L
Current Estimated Value
Home Financials for this Owner
Home Financials are based on the most recent Mortgage that was taken out on this home.
Original Mortgage
$165,000
Interest Rate
8.48%
Mortgage Type
Purchase Money Mortgage
Purchase Details
Closed on
Jul 21, 1995
Sold by
Burns John R and Burns Jean M
Bought by
Pontes Jeffrey P and Pontes Lisa A
Create a Home Valuation Report for This Property
The Home Valuation Report is an in-depth analysis detailing your home's value as well as a comparison with similar homes in the area
Home Values in the Area
Average Home Value in this Area
Purchase History
| Date | Buyer | Sale Price | Title Company |
|---|---|---|---|
| Macomber Jeffrey S | $183,401 | -- | |
| Pontes Jeffrey P | $146,900 | -- |
Source: Public Records
Mortgage History
| Date | Status | Borrower | Loan Amount |
|---|---|---|---|
| Open | Pontes Jeffrey P | $144,800 | |
| Closed | Pontes Jeffrey P | $165,600 | |
| Closed | Pontes Jeffrey P | $165,000 | |
| Previous Owner | Pontes Jeffrey P | $16,146 |
Source: Public Records
Tax History
| Year | Tax Paid | Tax Assessment Tax Assessment Total Assessment is a certain percentage of the fair market value that is determined by local assessors to be the total taxable value of land and additions on the property. | Land | Improvement |
|---|---|---|---|---|
| 2025 | $54 | $450,400 | $145,800 | $304,600 |
| 2024 | $5,210 | $418,500 | $125,600 | $292,900 |
| 2023 | $4,835 | $365,700 | $125,600 | $240,100 |
| 2022 | $4,692 | $341,200 | $109,200 | $232,000 |
| 2021 | $4,565 | $319,700 | $103,900 | $215,800 |
| 2020 | $4,445 | $305,900 | $92,000 | $213,900 |
| 2019 | $4,325 | $295,400 | $92,000 | $203,400 |
| 2018 | $3,962 | $282,600 | $88,500 | $194,100 |
| 2017 | $3,884 | $271,600 | $99,100 | $172,500 |
| 2016 | $3,762 | $253,500 | $99,100 | $154,400 |
| 2015 | $3,533 | $254,000 | $99,100 | $154,900 |
| 2014 | $3,388 | $264,500 | $107,600 | $156,900 |
Source: Public Records
Map
Nearby Homes
Your Personal Tour Guide
Ask me questions while you tour the home.