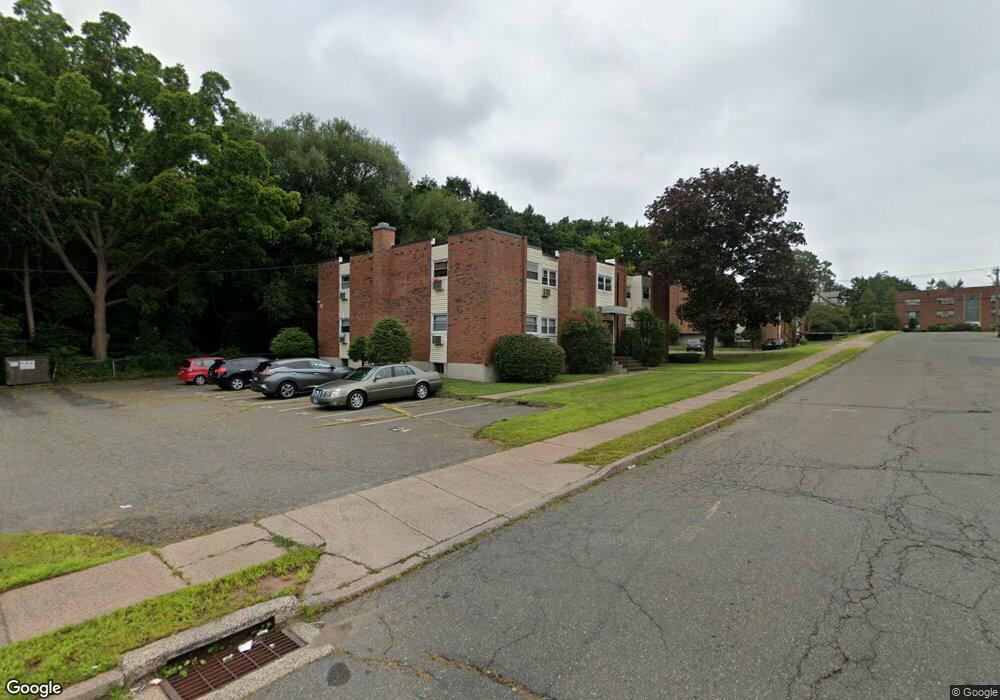
20 Thompson Rd Unit F Manchester, CT 06040
Verplanck NeighborhoodEstimated Value: $114,000 - $126,000
2
Beds
2
Baths
952
Sq Ft
$127/Sq Ft
Est. Value
About This Home
This home is located at 20 Thompson Rd Unit F, Manchester, CT 06040 and is currently estimated at $121,379, approximately $127 per square foot. 20 Thompson Rd Unit F is a home located in Hartford County with nearby schools including Verplanck School, Elisabeth M. Bennet Academy, and Illing Middle School.
Ownership History
Date
Name
Owned For
Owner Type
Purchase Details
Closed on
Jun 21, 2023
Sold by
Donald Pet Llc
Bought by
Cantu Malissa M and Khouvinegsay Tenny
Current Estimated Value
Home Financials for this Owner
Home Financials are based on the most recent Mortgage that was taken out on this home.
Original Mortgage
$71,625
Outstanding Balance
$69,696
Interest Rate
6.35%
Mortgage Type
Purchase Money Mortgage
Estimated Equity
$51,683
Purchase Details
Closed on
May 2, 2011
Sold by
Gmac Mtg
Bought by
Department Of Housing & Urban Dev
Purchase Details
Closed on
Jan 31, 2011
Sold by
Sousa Maria M
Bought by
Gmac Mortgage Llc
Purchase Details
Closed on
Sep 30, 2005
Sold by
Dixon Travis E
Bought by
Sousa Maria M
Home Financials for this Owner
Home Financials are based on the most recent Mortgage that was taken out on this home.
Original Mortgage
$82,450
Interest Rate
5.84%
Mortgage Type
Purchase Money Mortgage
Create a Home Valuation Report for This Property
The Home Valuation Report is an in-depth analysis detailing your home's value as well as a comparison with similar homes in the area
Home Values in the Area
Average Home Value in this Area
Purchase History
| Date | Buyer | Sale Price | Title Company |
|---|---|---|---|
| Cantu Malissa M | $95,500 | None Available | |
| Cantu Malissa M | $95,500 | None Available | |
| Department Of Housing & Urban Dev | -- | -- | |
| Department Of Housing & Urban Dev | -- | -- | |
| Gmac Mortgage Llc | -- | -- | |
| Gmac Mortgage Llc | -- | -- | |
| Sousa Maria M | $85,000 | -- | |
| Sousa Maria M | $85,000 | -- |
Source: Public Records
Mortgage History
| Date | Status | Borrower | Loan Amount |
|---|---|---|---|
| Open | Cantu Malissa M | $71,625 | |
| Closed | Cantu Malissa M | $71,625 | |
| Previous Owner | Sousa Maria M | $82,450 | |
| Previous Owner | Sousa Maria M | $24,100 |
Source: Public Records
Tax History Compared to Growth
Tax History
| Year | Tax Paid | Tax Assessment Tax Assessment Total Assessment is a certain percentage of the fair market value that is determined by local assessors to be the total taxable value of land and additions on the property. | Land | Improvement |
|---|---|---|---|---|
| 2025 | $1,828 | $45,900 | $0 | $45,900 |
| 2024 | $1,775 | $45,900 | $0 | $45,900 |
| 2023 | $1,707 | $45,900 | $0 | $45,900 |
| 2022 | $1,658 | $45,900 | $0 | $45,900 |
| 2021 | $1,870 | $44,600 | $0 | $44,600 |
| 2020 | $1,867 | $44,600 | $0 | $44,600 |
| 2019 | $1,860 | $44,600 | $0 | $44,600 |
| 2018 | $1,825 | $44,600 | $0 | $44,600 |
| 2017 | $1,773 | $44,600 | $0 | $44,600 |
| 2016 | $2,000 | $50,400 | $0 | $50,400 |
| 2015 | $1,986 | $50,400 | $0 | $50,400 |
| 2014 | $1,948 | $50,400 | $0 | $50,400 |
Source: Public Records
Map
Nearby Homes
- 20 Thompson Rd Unit 8A
- 23 Mckee St
- 600 Center St
- 14 Saint Lawrence St
- 633 Center St Unit E
- 633 Center St Unit A
- 142 W Center St
- 21 Saint John St
- 15 Saint John St
- 158 Mckee St
- 113 Deepwood Dr
- 149 Deepwood Dr
- 15 Deepwood Dr
- 65 Deepwood Dr
- 9 Deepwood Dr
- 36 Oleary Dr
- 32 Dudley St
- 29 Summer St
- 67 Olcott Dr
- 47 Crestwood Dr
- 20 Thompson Rd Unit 2F
- 20 Thompson Rd Unit 8A
- 20 Thompson Rd Unit H
- 20 Thompson Rd Unit G
- 20 Thompson Rd Unit E
- 20 Thompson Rd Unit D
- 20 Thompson Rd Unit C
- 20 Thompson Rd Unit B
- 20 Thompson Rd Unit A
- 20 Thompson Rd Unit A
- 20 Thompson Rd Unit 8B
- 20 Thompson Rd Unit 8F
- 20 Thompson Rd Unit 10A
- 12 Thompson Rd Unit H
- 12 Thompson Rd Unit G
- 12 Thompson Rd Unit F
- 12 Thompson Rd Unit E
- 12 Thompson Rd Unit D
- 12 Thompson Rd Unit C
- 12 Thompson Rd Unit B