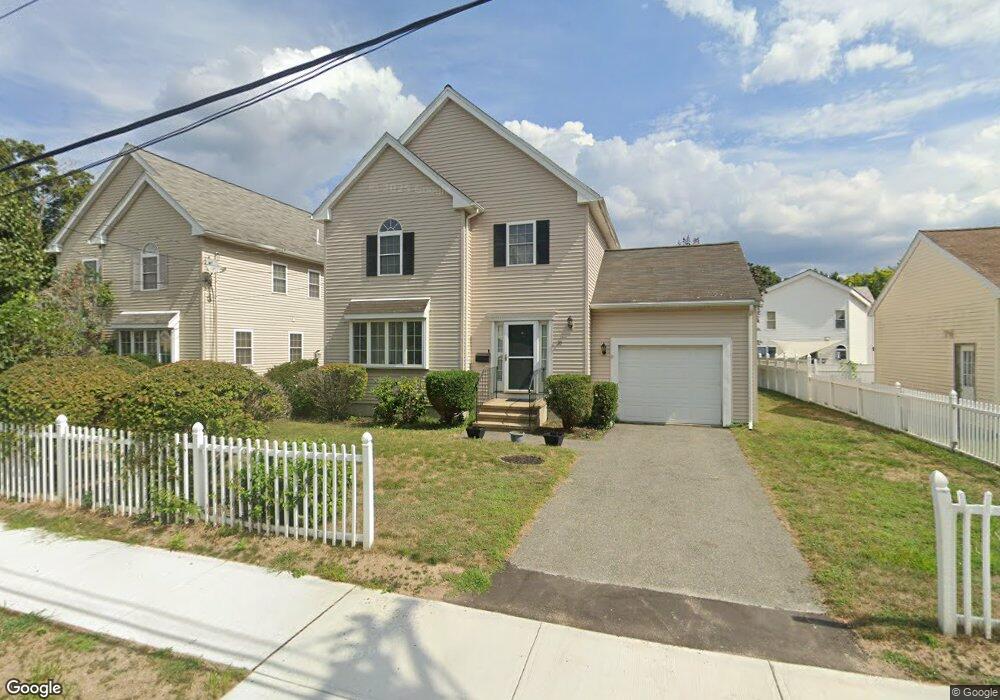
20 Totman St Quincy, MA 02169
South Quincy NeighborhoodEstimated Value: $795,000 - $918,000
3
Beds
2
Baths
1,832
Sq Ft
$469/Sq Ft
Est. Value
About This Home
This home is located at 20 Totman St, Quincy, MA 02169 and is currently estimated at $858,764, approximately $468 per square foot. 20 Totman St is a home located in Norfolk County with nearby schools including South West Middle School, Lincoln-Hancock Community School, and Quincy High School.
Ownership History
Date
Name
Owned For
Owner Type
Purchase Details
Closed on
Jun 27, 2007
Sold by
Connor Brian J and Connor Helen A
Bought by
Mon Jackson
Current Estimated Value
Home Financials for this Owner
Home Financials are based on the most recent Mortgage that was taken out on this home.
Original Mortgage
$375,000
Outstanding Balance
$231,185
Interest Rate
6.24%
Mortgage Type
Purchase Money Mortgage
Estimated Equity
$627,579
Create a Home Valuation Report for This Property
The Home Valuation Report is an in-depth analysis detailing your home's value as well as a comparison with similar homes in the area
Home Values in the Area
Average Home Value in this Area
Purchase History
| Date | Buyer | Sale Price | Title Company |
|---|---|---|---|
| Mon Jackson | $470,000 | -- |
Source: Public Records
Mortgage History
| Date | Status | Borrower | Loan Amount |
|---|---|---|---|
| Open | Mon Jackson | $375,000 |
Source: Public Records
Tax History Compared to Growth
Tax History
| Year | Tax Paid | Tax Assessment Tax Assessment Total Assessment is a certain percentage of the fair market value that is determined by local assessors to be the total taxable value of land and additions on the property. | Land | Improvement |
|---|---|---|---|---|
| 2025 | $9,330 | $809,200 | $285,000 | $524,200 |
| 2024 | $8,847 | $785,000 | $271,400 | $513,600 |
| 2023 | $8,060 | $724,200 | $246,700 | $477,500 |
| 2022 | $7,926 | $661,600 | $205,600 | $456,000 |
| 2021 | $7,715 | $635,500 | $205,600 | $429,900 |
| 2020 | $7,520 | $605,000 | $205,600 | $399,400 |
| 2019 | $7,211 | $574,600 | $194,000 | $380,600 |
| 2018 | $6,997 | $524,500 | $179,600 | $344,900 |
| 2017 | $6,846 | $483,100 | $171,100 | $312,000 |
| 2016 | $6,384 | $444,600 | $148,700 | $295,900 |
| 2015 | $6,126 | $419,600 | $148,700 | $270,900 |
| 2014 | $5,928 | $398,900 | $148,700 | $250,200 |
Source: Public Records
Map
Nearby Homes
- 21 Totman St Unit 202
- 21 Totman St Unit 309
- 21 Totman St Unit Model-1
- 21 Totman St Unit 209
- 21 Totman St Unit 203
- 21 Totman St Unit 2
- 347 Centre St
- 56 Penn St Unit 4
- 118 Brook Rd Unit 2
- 192 Federal Ave Unit B
- 9 Independence Ave Unit 307
- 94 Brook Rd Unit 3
- 177 Franklin St
- 64 Garfield St Unit B
- 51 Brook Rd
- 91 Garfield St
- 8 Jackson St Unit B2
- 21 Arthur St
- 14 Arthur Ave
- 50 N Payne St Unit 1
- 24 Totman St
- 26 Totman St
- 18 Totman St
- 259 Liberty St
- 30 Totman St
- 247 Liberty St
- 261 Liberty St
- 335 Centre St
- 337 Centre St
- 337 Centre St Unit 1
- 34 Totman St
- 27 Totman St
- 347 Centre St Unit 2
- 341 Centre St
- 21 Totman St Unit 204
- 21 Totman St Unit 308
- 269 Liberty St
- 33 Totman St
- 329 Centre St
- 242 Liberty St