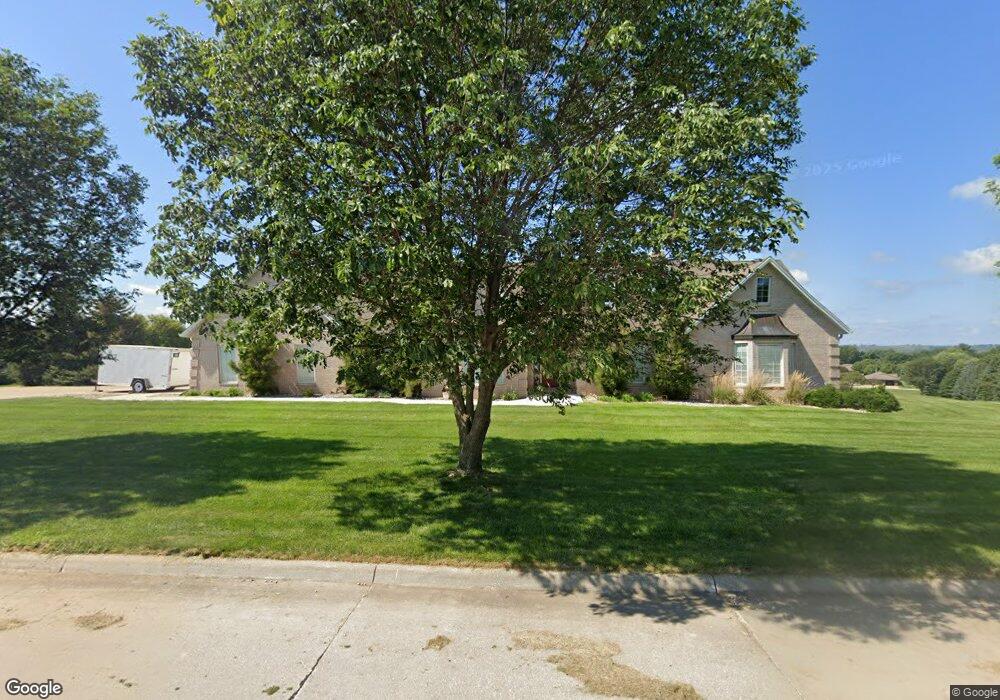
20 Tower St Mapleton, IA 51034
Estimated Value: $437,000 - $645,000
2
Beds
3
Baths
5,858
Sq Ft
$90/Sq Ft
Est. Value
About This Home
This home is located at 20 Tower St, Mapleton, IA 51034 and is currently estimated at $529,337, approximately $90 per square foot. 20 Tower St is a home located in Monona County with nearby schools including Mapleton Elementary School, Mvao Middle School, and Maple Valley-Anthon Oto High School.
Ownership History
Date
Name
Owned For
Owner Type
Purchase Details
Closed on
Aug 26, 2025
Sold by
Bollin Brice Franklin and Bollin Kristi Emily
Bought by
Brice F Bollin And Kristi E Bollin Revocable and Bollin
Current Estimated Value
Purchase Details
Closed on
Nov 21, 2011
Sold by
Standa Fred L and Standa Kathleen R
Bought by
Bretthauer Crystal K
Home Financials for this Owner
Home Financials are based on the most recent Mortgage that was taken out on this home.
Original Mortgage
$308,000
Interest Rate
4.08%
Mortgage Type
New Conventional
Create a Home Valuation Report for This Property
The Home Valuation Report is an in-depth analysis detailing your home's value as well as a comparison with similar homes in the area
Purchase History
| Date | Buyer | Sale Price | Title Company |
|---|---|---|---|
| Brice F Bollin And Kristi E Bollin Revocable | -- | None Listed On Document | |
| Bretthauer Crystal K | $384,875 | None Available |
Source: Public Records
Mortgage History
| Date | Status | Borrower | Loan Amount |
|---|---|---|---|
| Previous Owner | Bretthauer Crystal K | $308,000 |
Source: Public Records
Tax History
| Year | Tax Paid | Tax Assessment Tax Assessment Total Assessment is a certain percentage of the fair market value that is determined by local assessors to be the total taxable value of land and additions on the property. | Land | Improvement |
|---|---|---|---|---|
| 2024 | $8,210 | $536,414 | $40,935 | $495,479 |
| 2023 | $7,834 | $536,414 | $40,935 | $495,479 |
| 2022 | $6,364 | $426,610 | $0 | $0 |
| 2021 | $6,658 | $390,916 | $34,952 | $355,964 |
| 2020 | $8,202 | $390,916 | $34,952 | $355,964 |
| 2019 | $8,202 | $455,656 | $0 | $0 |
| 2018 | $8,026 | $455,656 | $0 | $0 |
| 2017 | $8,026 | $433,958 | $0 | $0 |
| 2016 | $7,848 | $433,958 | $0 | $0 |
| 2015 | $7,408 | $384,034 | $0 | $0 |
| 2014 | $6,768 | $384,034 | $0 | $0 |
Source: Public Records
Map
Nearby Homes
Your Personal Tour Guide
Ask me questions while you tour the home.