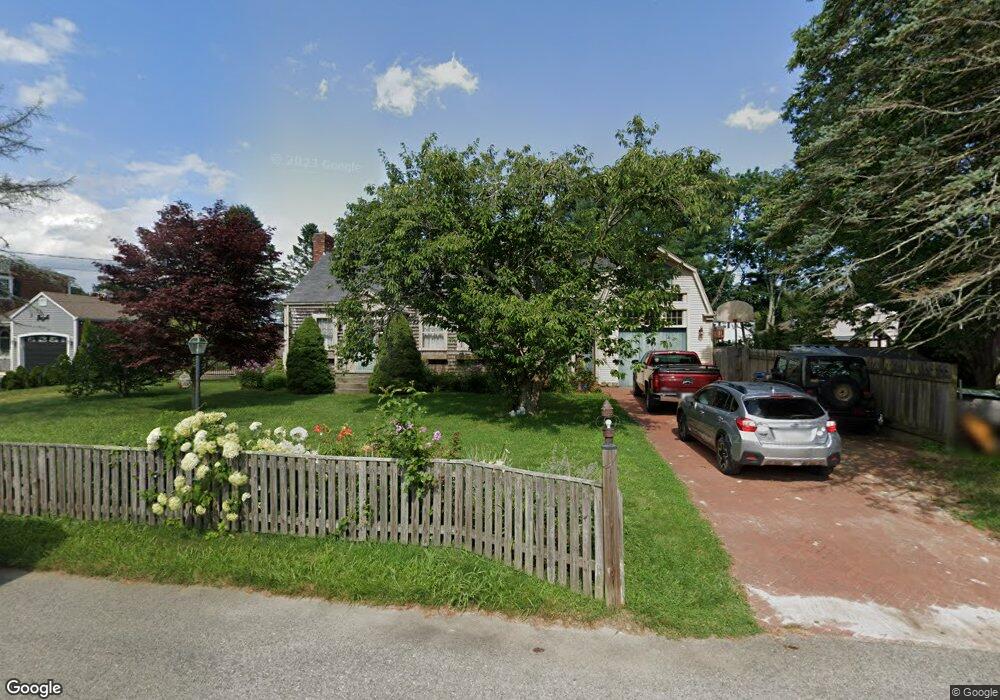
20 Truman St Westport, MA 02790
North Westport NeighborhoodEstimated Value: $505,000 - $727,000
3
Beds
2
Baths
3,045
Sq Ft
$205/Sq Ft
Est. Value
About This Home
This home is located at 20 Truman St, Westport, MA 02790 and is currently estimated at $622,872, approximately $204 per square foot. 20 Truman St is a home located in Bristol County with nearby schools including Alice A. Macomber Primary School, Westport Elementary School, and Westport Middle-High School.
Ownership History
Date
Name
Owned For
Owner Type
Purchase Details
Closed on
Oct 26, 2022
Sold by
Bramwell Robert B and Bramwell Linda S
Bought by
Bramwell Robert B and Bramwell Linda S
Current Estimated Value
Purchase Details
Closed on
Sep 19, 1974
Bought by
Bramwell Robert B and Bramwell Linda S
Create a Home Valuation Report for This Property
The Home Valuation Report is an in-depth analysis detailing your home's value as well as a comparison with similar homes in the area
Home Values in the Area
Average Home Value in this Area
Purchase History
| Date | Buyer | Sale Price | Title Company |
|---|---|---|---|
| Bramwell Robert B | -- | None Available | |
| Bramwell Robert B | -- | -- |
Source: Public Records
Mortgage History
| Date | Status | Borrower | Loan Amount |
|---|---|---|---|
| Previous Owner | Bramwell Robert B | $213,000 | |
| Previous Owner | Bramwell Robert B | $70,000 | |
| Previous Owner | Bramwell Robert B | $50,000 |
Source: Public Records
Tax History Compared to Growth
Tax History
| Year | Tax Paid | Tax Assessment Tax Assessment Total Assessment is a certain percentage of the fair market value that is determined by local assessors to be the total taxable value of land and additions on the property. | Land | Improvement |
|---|---|---|---|---|
| 2025 | $3,737 | $501,600 | $159,600 | $342,000 |
| 2024 | $3,618 | $468,100 | $147,900 | $320,200 |
| 2023 | $3,556 | $435,800 | $134,700 | $301,100 |
| 2022 | $3,211 | $378,700 | $122,500 | $256,200 |
| 2021 | $2,757 | $340,000 | $111,400 | $228,600 |
| 2020 | $2,828 | $335,500 | $106,900 | $228,600 |
| 2019 | $2,565 | $326,700 | $106,900 | $219,800 |
| 2018 | $3,188 | $271,000 | $108,100 | $162,900 |
| 2017 | $4,583 | $269,000 | $104,600 | $164,400 |
| 2016 | $2,101 | $265,600 | $101,200 | $164,400 |
| 2015 | $2,088 | $263,300 | $103,500 | $159,800 |
Source: Public Records
Map
Nearby Homes