Estimated Value: $247,000 - $433,000
--
Bed
1
Bath
3,289
Sq Ft
$110/Sq Ft
Est. Value
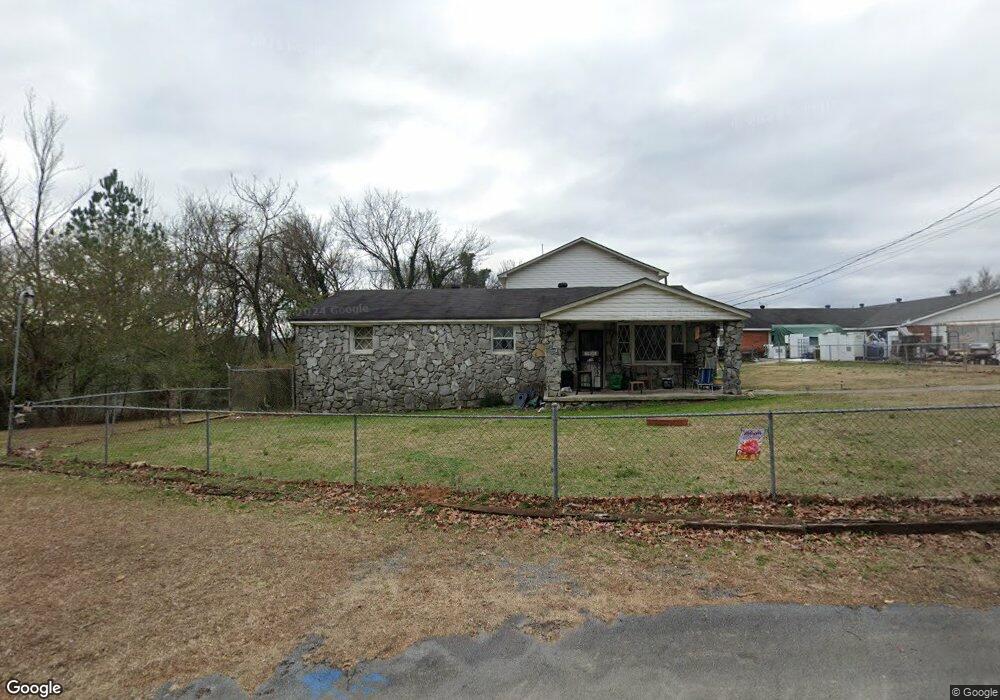
About This Home
This home is located at 20 Tumlin Dr SE, Rome, GA 30161 and is currently estimated at $361,427, approximately $109 per square foot. 20 Tumlin Dr SE is a home located in Floyd County with nearby schools including Pepperell Middle School, Pepperell High School, and Montessori School of Rome.
Ownership History
Date
Name
Owned For
Owner Type
Purchase Details
Closed on
Apr 10, 2017
Sold by
Tang Thanh T
Bought by
Herrington Christopher and Hanson Kathryn E
Current Estimated Value
Purchase Details
Closed on
May 26, 2006
Sold by
Not Provided
Bought by
Herrington Chris 1 4 and Herrington Kathryn E Hanson 1 4 Than
Home Financials for this Owner
Home Financials are based on the most recent Mortgage that was taken out on this home.
Original Mortgage
$136,000
Interest Rate
7.75%
Mortgage Type
New Conventional
Purchase Details
Closed on
May 17, 2006
Sold by
Not Provided
Bought by
Herrington Chris 1 4 and Herrington Kathryn E Hanson 1 4 Than
Home Financials for this Owner
Home Financials are based on the most recent Mortgage that was taken out on this home.
Original Mortgage
$136,000
Interest Rate
7.75%
Mortgage Type
New Conventional
Purchase Details
Closed on
Mar 5, 1985
Bought by
Layne Cecil Gregory and Layne Judy
Create a Home Valuation Report for This Property
The Home Valuation Report is an in-depth analysis detailing your home's value as well as a comparison with similar homes in the area
Home Values in the Area
Average Home Value in this Area
Purchase History
| Date | Buyer | Sale Price | Title Company |
|---|---|---|---|
| Herrington Christopher | $30,000 | -- | |
| Herrington Chris 1 4 | -- | -- | |
| Herrington Chris 1 4 | $170,000 | -- | |
| Layne Cecil Gregory | $46,600 | -- |
Source: Public Records
Mortgage History
| Date | Status | Borrower | Loan Amount |
|---|---|---|---|
| Previous Owner | Herrington Chris 1 4 | $136,000 |
Source: Public Records
Tax History Compared to Growth
Tax History
| Year | Tax Paid | Tax Assessment Tax Assessment Total Assessment is a certain percentage of the fair market value that is determined by local assessors to be the total taxable value of land and additions on the property. | Land | Improvement |
|---|---|---|---|---|
| 2024 | $2,714 | $87,768 | $14,454 | $73,314 |
| 2023 | $2,511 | $84,703 | $13,140 | $71,563 |
| 2022 | $2,027 | $68,304 | $10,424 | $57,880 |
| 2021 | $1,717 | $56,882 | $9,482 | $47,400 |
| 2020 | $1,628 | $53,499 | $8,245 | $45,254 |
| 2019 | $1,539 | $51,245 | $8,245 | $43,000 |
| 2018 | $1,459 | $48,492 | $7,852 | $40,640 |
| 2017 | $1,196 | $46,687 | $7,271 | $39,416 |
| 2016 | $1,512 | $49,553 | $7,240 | $42,313 |
| 2015 | -- | $49,553 | $7,240 | $42,313 |
| 2014 | -- | $49,553 | $7,240 | $42,313 |
Source: Public Records
Map
Nearby Homes
- 7 Crestview Ln SE
- 14 Gables Dr SE
- 46 Turnbull Dr SE
- 12 Turnbull Dr SE
- 1 Joe Louis Blvd SE
- 74 Dodd Blvd SE
- 2512 Callier Springs Rd SE
- 0 Turnbull Dr SE Unit 10570009
- 13 Townview Rd SE
- 9 Richland Ct SE
- 1 Vassar Dr SE
- 93 Dodd Blvd SE
- 95 Dodd Blvd SE
- 1314 E 2nd Ave SE
- 145 Mountain View Rd SE
- 415 E 10th St SE
- 211 E 11th St SE
- 525 E 14th St SW
- 452 Mountain View Rd SE
- 0 Highway 411 SE Unit 7692418
- 22 Tumlin Dr SE
- 14 Tumlin Dr
- 8 Tumlin Dr SE
- 33 Gables Dr SE
- 35 Gables Dr SE Unit 18
- 35 Gables Dr SE
- 29 Gables Dr SE
- 29 Gables Dr SE
- 6 Tumlin Dr SE
- 6 Tumlin Dr SE
- 2603 Callier Springs Rd SE
- 2603 Callier Springs Rd SE
- 2625 Callier Springs Rd SE
- 2625 Callier Springs Rd SE
- 2625 Callier Springs Rd SE
- 2625 Callier Springs Rd SE
- 2625 Callier Springs Rd SE
- 2625 Callier Springs Rd SE
- 2625 Callier Springs Rd SE
- 32 Gables Dr SE