Estimated Value: $285,638 - $343,000
Studio
1
Bath
2,259
Sq Ft
$142/Sq Ft
Est. Value
About This Home
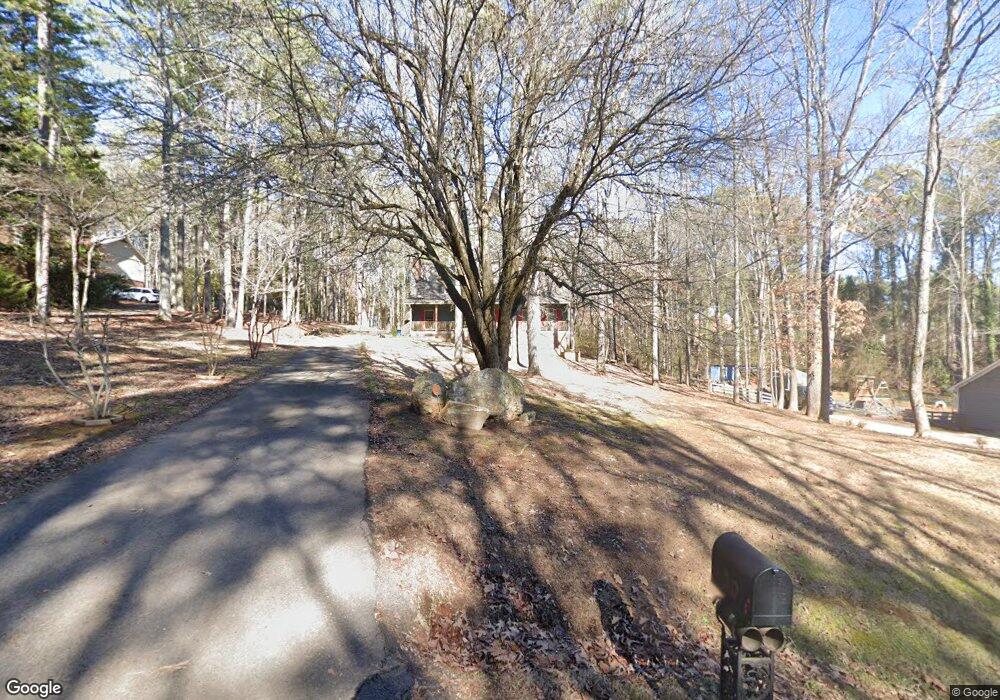
This home is located at 20 Twickenham Rd SE, Rome, GA 30161 and is currently estimated at $320,910, approximately $142 per square foot. 20 Twickenham Rd SE is a home located in Floyd County with nearby schools including Pepperell Middle School, Pepperell High School, and Montessori School of Rome.
Ownership History
Date
Name
Owned For
Owner Type
Purchase Details
Closed on
Feb 9, 1989
Sold by
Allen Donald W and Allen Anne H
Bought by
Raspotnik Mark E and Raspotnik Carole A
Current Estimated Value
Purchase Details
Closed on
Nov 17, 1986
Sold by
Gaylor Robert Ervin and Donna Beth Mull
Bought by
Allen Donald W and Allen Anne H
Purchase Details
Closed on
Aug 1, 1985
Sold by
N R S Properties Inc
Bought by
Gaylor Robert Ervin and Donna Beth
Purchase Details
Closed on
Feb 5, 1985
Bought by
P and R
Purchase Details
Closed on
Jan 8, 1985
Sold by
Johnson William F
Bought by
N R S Properties Inc
Purchase Details
Closed on
Nov 16, 1981
Sold by
Easterwood Richard and Easterwood Elizabeth
Bought by
Johnson William F
Purchase Details
Closed on
Aug 4, 1980
Sold by
N R S Prop Inc
Bought by
Easterwood Richard and Easterwood Elizabeth
Purchase Details
Closed on
Nov 1, 1970
Sold by
Woods M B
Bought by
N R S Prop Inc
Purchase Details
Closed on
Jan 1, 1901
Bought by
Woods M B
Create a Home Valuation Report for This Property
The Home Valuation Report is an in-depth analysis detailing your home's value as well as a comparison with similar homes in the area
Home Values in the Area
Average Home Value in this Area
Purchase History
| Date | Buyer | Sale Price | Title Company |
|---|---|---|---|
| Raspotnik Mark E | $105,000 | -- | |
| Allen Donald W | $8,000 | -- | |
| Gaylor Robert Ervin | -- | -- | |
| P | $5,500 | -- | |
| N R S Properties Inc | $8,700 | -- | |
| Johnson William F | $54,800 | -- | |
| Easterwood Richard | $56,300 | -- | |
| N R S Prop Inc | -- | -- | |
| Woods M B | -- | -- |
Source: Public Records
Tax History
| Year | Tax Paid | Tax Assessment Tax Assessment Total Assessment is a certain percentage of the fair market value that is determined by local assessors to be the total taxable value of land and additions on the property. | Land | Improvement |
|---|---|---|---|---|
| 2025 | $1,968 | $113,497 | $10,749 | $102,748 |
| 2024 | $2,052 | $118,180 | $9,772 | $108,408 |
| 2023 | $1,390 | $109,063 | $8,686 | $100,377 |
| 2022 | $1,651 | $91,467 | $7,058 | $84,409 |
| 2021 | $1,529 | $83,372 | $6,514 | $76,858 |
| 2020 | $1,366 | $73,871 | $5,157 | $68,714 |
| 2019 | $1,198 | $66,091 | $5,157 | $60,934 |
| 2018 | $1,139 | $62,935 | $5,157 | $57,778 |
| 2017 | $1,047 | $59,278 | $5,157 | $54,121 |
| 2016 | $1,739 | $58,400 | $5,120 | $53,280 |
| 2015 | $1,750 | $59,935 | $5,120 | $54,815 |
| 2014 | $1,750 | $59,935 | $5,120 | $54,815 |
Source: Public Records
Map
Nearby Homes
- 9 Wellington Way SE
- 18 Wellington Way SE
- 0 Twickenham Rd SE Unit 10707322
- 0 Twickenham Rd SE Unit 7732642
- 31 Coventry Dr SE
- 36 Coventry Dr SE
- 11 Cambridge Dr SE
- 22 Coventry Dr SE
- 0 Wellington Way SE Unit 10693561
- 0 Wellington Way SE Unit 7721620
- 0 Wellington Way SE Unit 7721621
- 0 Wellington Way SE Unit 10693583
- 30 Coventry Dr SE
- 20 Coventry Dr SE
- 11 Cumberland Dr SE
- 85 Cambridge Dr SE
- 102 Margo Trail SE
- 10 Cumberland Dr SE
- 14 Saddlebrook Dr SE
- 15 Saddlebrook Dr SE
- 18 Twickenham Rd SE
- 22 Twickenham Rd SE
- 24 Twickenham Rd SE
- 21 Twickenham Rd SE
- 19 Twickenham Rd SE
- 11 Wellington Way SE
- 26 Twickenham Rd SE
- 7 Wellington Way SE
- 13 Wellington Way SE
- 15 Wellington Way SE
- 19 Wellington Way SE
- 5 Wellington Way SE
- 17 Wellington Way SE
- 23 Twickenham Rd SE
- 21 Wellington Way SE
- 28 Twickenham Rd SE
- 28 Twickenham Rd SE
- 28 Twickenham Rd SE Unit 200
- 3 Wellington Way SE
- 31 Wellington Way SE
Your Personal Tour Guide
Ask me questions while you tour the home.