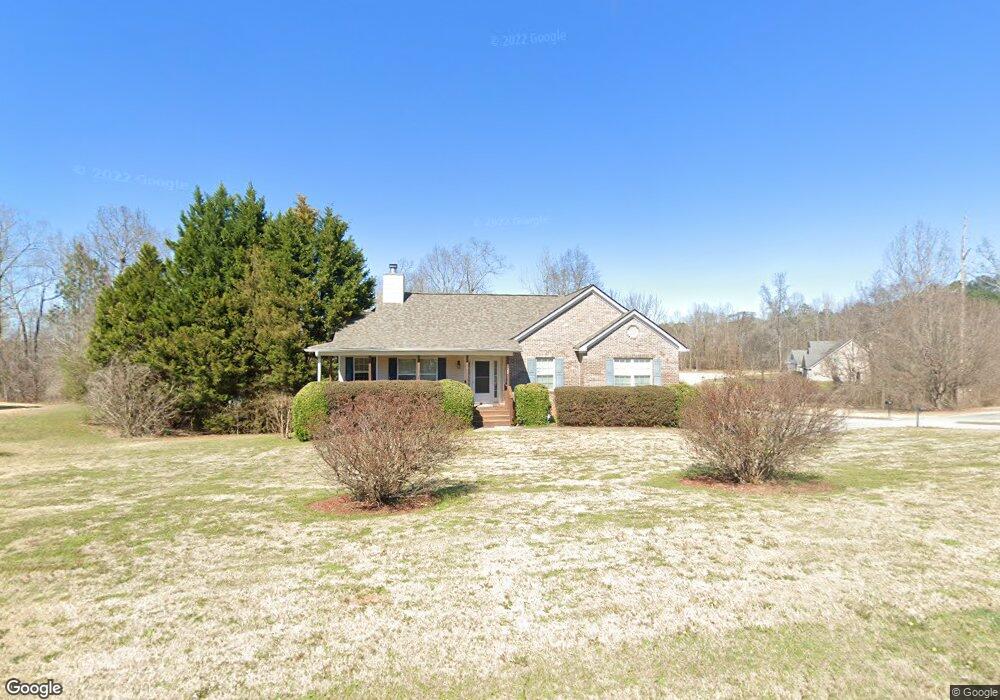
20 Tyler Ln Unit 30 Covington, GA 30016
Estimated Value: $281,000 - $307,000
4
Beds
3
Baths
2,565
Sq Ft
$112/Sq Ft
Est. Value
About This Home
This home is located at 20 Tyler Ln Unit 30, Covington, GA 30016 and is currently estimated at $288,243, approximately $112 per square foot. 20 Tyler Ln Unit 30 is a home located in Newton County with nearby schools including Livingston Elementary School, Indian Creek Middle School, and Alcovy High School.
Ownership History
Date
Name
Owned For
Owner Type
Purchase Details
Closed on
Jun 14, 2016
Sold by
Crawford Steven J
Bought by
Morgan David J and Morgan Jaunita A
Current Estimated Value
Home Financials for this Owner
Home Financials are based on the most recent Mortgage that was taken out on this home.
Original Mortgage
$144,001
Outstanding Balance
$114,646
Interest Rate
3.58%
Mortgage Type
VA
Estimated Equity
$173,597
Purchase Details
Closed on
Nov 15, 2011
Sold by
Pnc Bank National Associat
Bought by
Crawford Steven J
Home Financials for this Owner
Home Financials are based on the most recent Mortgage that was taken out on this home.
Original Mortgage
$82,964
Interest Rate
4.75%
Mortgage Type
FHA
Purchase Details
Closed on
Sep 6, 2011
Sold by
Perez William A
Bought by
Pnc Bank National Association
Create a Home Valuation Report for This Property
The Home Valuation Report is an in-depth analysis detailing your home's value as well as a comparison with similar homes in the area
Home Values in the Area
Average Home Value in this Area
Purchase History
| Date | Buyer | Sale Price | Title Company |
|---|---|---|---|
| Morgan David J | $144,001 | -- | |
| Crawford Steven J | $77,000 | -- | |
| Pnc Bank National Association | $12,000 | -- |
Source: Public Records
Mortgage History
| Date | Status | Borrower | Loan Amount |
|---|---|---|---|
| Open | Morgan David J | $144,001 | |
| Previous Owner | Crawford Steven J | $82,964 |
Source: Public Records
Tax History Compared to Growth
Tax History
| Year | Tax Paid | Tax Assessment Tax Assessment Total Assessment is a certain percentage of the fair market value that is determined by local assessors to be the total taxable value of land and additions on the property. | Land | Improvement |
|---|---|---|---|---|
| 2024 | $1,873 | $112,920 | $18,800 | $94,120 |
| 2023 | $2,094 | $103,760 | $10,000 | $93,760 |
| 2022 | $1,491 | $81,560 | $7,800 | $73,760 |
| 2021 | $1,333 | $70,920 | $10,000 | $60,920 |
| 2020 | $1,274 | $65,240 | $6,800 | $58,440 |
| 2019 | $1,264 | $64,400 | $6,800 | $57,600 |
| 2018 | $1,195 | $62,160 | $6,800 | $55,360 |
| 2017 | $851 | $52,160 | $6,800 | $45,360 |
| 2016 | $1,572 | $47,840 | $4,800 | $43,040 |
| 2015 | $1,330 | $40,800 | $4,800 | $36,000 |
| 2014 | $1,084 | $33,680 | $0 | $0 |
Source: Public Records
Map
Nearby Homes
- 1752 Highway 162
- 105 Heyman Dr Unit 79
- 35 Heyman Dr Unit 85
- 0 Chestnut Rd Unit 10616695
- 70 Mountainside Ln
- 165 Wildcat Creek Dr
- 40 Timberwoods Dr
- 135 Lumby Ln
- 115 Mountainview Dr
- 25 Shady Oaks Trail
- 125 Shelby Oaks Trail
- The Northview Plan at Hampton Place Estates
- The Carrollton Plan at Hampton Place Estates
- The Wendell Plan at Hampton Place Estates
- The Donovan Plan at Hampton Place Estates
- The Kendall Plan at Hampton Place Estates
- The Rosewood Plan at Hampton Place Estates
- The Brookdale Plan at Hampton Place Estates
- The Chadwick Plan at Hampton Place Estates
- 160 Cross Rd