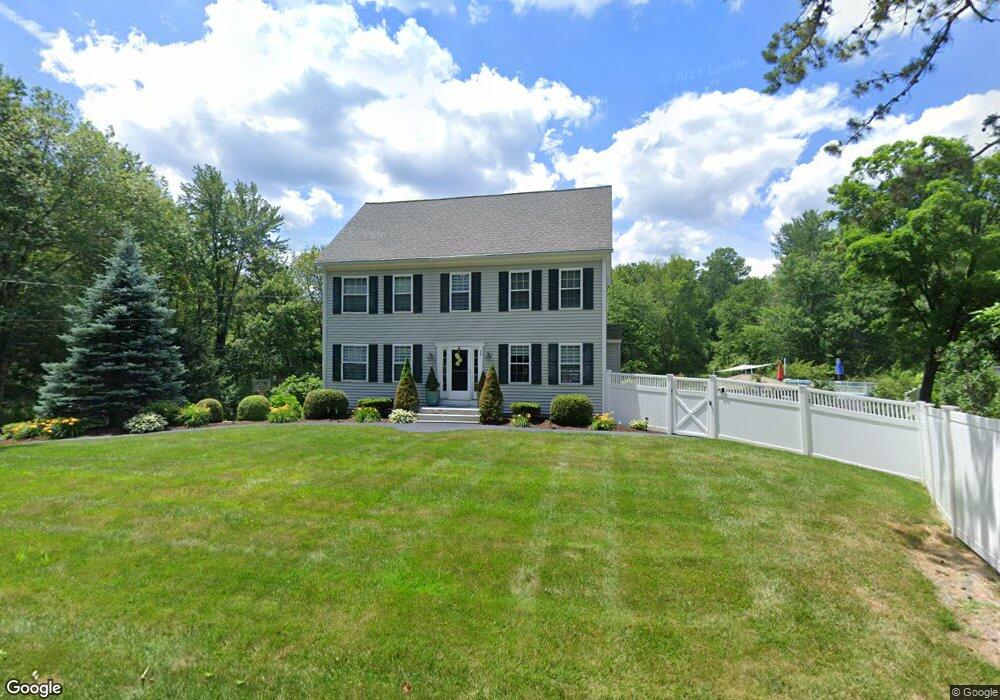
20 Tyng Rd Tyngsboro, MA 01879
Estimated Value: $723,000 - $799,834
3
Beds
3
Baths
1,872
Sq Ft
$409/Sq Ft
Est. Value
About This Home
This home is located at 20 Tyng Rd, Tyngsboro, MA 01879 and is currently estimated at $764,959, approximately $408 per square foot. 20 Tyng Rd is a home located in Middlesex County with nearby schools including Tyngsborough Elementary School, Tyngsborough Middle School, and Tyngsborough High School.
Ownership History
Date
Name
Owned For
Owner Type
Purchase Details
Closed on
Feb 26, 2008
Sold by
Lowell Building Assoc
Bought by
Depascale Enrica and Depascale Stephen M
Current Estimated Value
Home Financials for this Owner
Home Financials are based on the most recent Mortgage that was taken out on this home.
Original Mortgage
$341,905
Outstanding Balance
$214,824
Interest Rate
5.9%
Mortgage Type
Purchase Money Mortgage
Estimated Equity
$550,135
Purchase Details
Closed on
Sep 19, 2007
Sold by
Sambataro Margaret A and Perrot Margaret Sulliv
Bought by
Lowel Building Assoc L
Create a Home Valuation Report for This Property
The Home Valuation Report is an in-depth analysis detailing your home's value as well as a comparison with similar homes in the area
Home Values in the Area
Average Home Value in this Area
Purchase History
| Date | Buyer | Sale Price | Title Company |
|---|---|---|---|
| Depascale Enrica | $359,900 | -- | |
| Lowel Building Assoc L | $79,000 | -- |
Source: Public Records
Mortgage History
| Date | Status | Borrower | Loan Amount |
|---|---|---|---|
| Open | Depascale Enrica | $341,905 |
Source: Public Records
Tax History Compared to Growth
Tax History
| Year | Tax Paid | Tax Assessment Tax Assessment Total Assessment is a certain percentage of the fair market value that is determined by local assessors to be the total taxable value of land and additions on the property. | Land | Improvement |
|---|---|---|---|---|
| 2025 | $79 | $638,600 | $247,200 | $391,400 |
| 2024 | $7,814 | $614,300 | $234,000 | $380,300 |
| 2023 | $7,124 | $503,800 | $194,800 | $309,000 |
| 2022 | $6,854 | $458,800 | $170,800 | $288,000 |
| 2021 | $6,724 | $418,400 | $155,600 | $262,800 |
| 2020 | $6,596 | $405,900 | $146,800 | $259,100 |
| 2019 | $0 | $374,200 | $140,300 | $233,900 |
| 2018 | $10,562 | $361,400 | $140,300 | $221,100 |
| 2017 | $5,967 | $347,700 | $140,300 | $207,400 |
| 2016 | $5,837 | $332,400 | $140,300 | $192,100 |
| 2015 | $5,638 | $332,400 | $140,300 | $192,100 |
Source: Public Records
Map
Nearby Homes
- 48 Mission Rd
- 5 Bridgeview Cir Unit 22
- 5 Mission Rd Unit 203
- 1 Hope St
- 915 Wellman Ave Unit 915
- 44 Shakespeare St
- 12 Kestrel Ln Unit 7
- 123 Sherburne Ave
- 111 Sherburne Ave
- 24 Old Tyng Rd
- 10 Dickens Ln
- 109 Sherburne Ave
- 413 Wellman Ave Unit 413
- 139 Wellman Ave Unit 139
- 271 Wellman Ave
- 202 Wellman Ave
- 739 Wellman Ave
- 406 Wellman Ave
- 348 Wellman Ave
- 10 Butterfield St