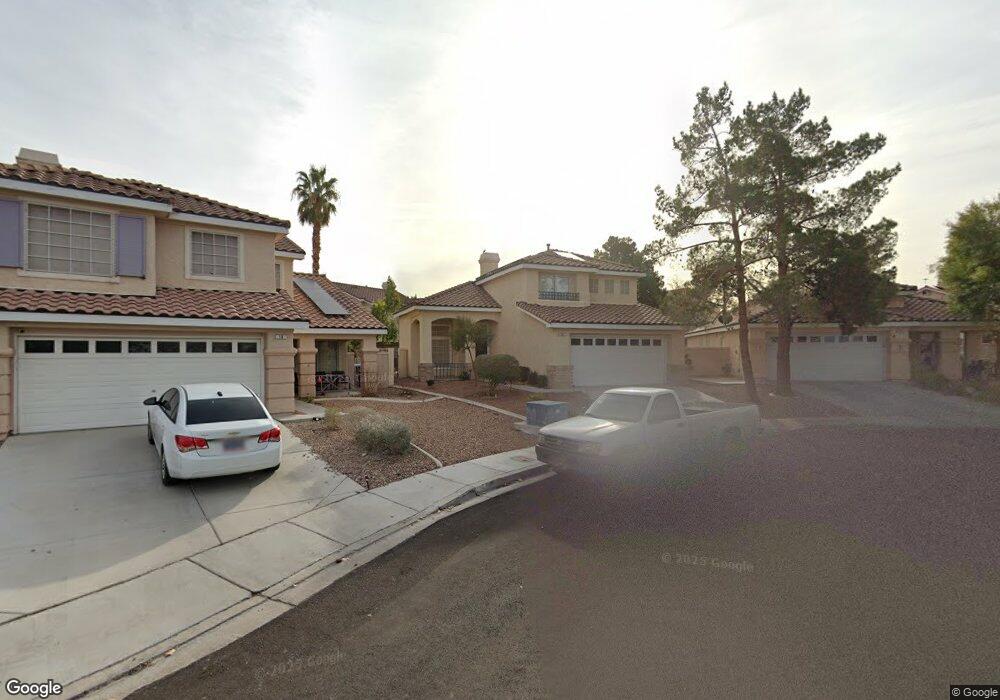
20 Via de Pescara Henderson, NV 89074
Green Valley South NeighborhoodEstimated Value: $440,000 - $470,000
3
Beds
3
Baths
1,517
Sq Ft
$297/Sq Ft
Est. Value
About This Home
This home is located at 20 Via de Pescara, Henderson, NV 89074 and is currently estimated at $451,290, approximately $297 per square foot. 20 Via de Pescara is a home located in Clark County with nearby schools including John Vanderburg Elementary School, Neil C. Twitchell Elementary School, and Bob Miller Middle School.
Ownership History
Date
Name
Owned For
Owner Type
Purchase Details
Closed on
Apr 13, 2009
Sold by
Morequity Inc
Bought by
Laforga Daisy
Current Estimated Value
Home Financials for this Owner
Home Financials are based on the most recent Mortgage that was taken out on this home.
Original Mortgage
$110,400
Outstanding Balance
$68,924
Interest Rate
4.71%
Mortgage Type
Unknown
Estimated Equity
$382,366
Purchase Details
Closed on
Oct 10, 2008
Sold by
Rodriguez Richard and Rodriguez Marcalee E
Bought by
Morequity Inc
Purchase Details
Closed on
Aug 26, 2006
Sold by
Rodriguez Marcalee and Rodriguez Richard
Bought by
Rodriguez Richard and Rodriguez Marcalee E
Home Financials for this Owner
Home Financials are based on the most recent Mortgage that was taken out on this home.
Original Mortgage
$256,000
Interest Rate
1%
Mortgage Type
Negative Amortization
Purchase Details
Closed on
Mar 23, 2006
Sold by
Rodriguez Richard J and Rodriguez Marcalee E
Bought by
Rodriguez Richard and Rodriguez Marcalee
Home Financials for this Owner
Home Financials are based on the most recent Mortgage that was taken out on this home.
Original Mortgage
$264,000
Interest Rate
7.25%
Mortgage Type
New Conventional
Purchase Details
Closed on
May 26, 2000
Sold by
Taylor Justina D and Lewis Justina D
Bought by
Rodriguez Richard J and Rodriguez Marcalee E
Home Financials for this Owner
Home Financials are based on the most recent Mortgage that was taken out on this home.
Original Mortgage
$136,800
Interest Rate
11.48%
Purchase Details
Closed on
Aug 20, 1997
Sold by
Hud
Bought by
Lewis Justina D
Home Financials for this Owner
Home Financials are based on the most recent Mortgage that was taken out on this home.
Original Mortgage
$118,045
Interest Rate
7.43%
Mortgage Type
FHA
Purchase Details
Closed on
Jan 30, 1997
Sold by
Norwest Mtg Inc
Bought by
Hud
Purchase Details
Closed on
Nov 27, 1996
Sold by
Treston John G and Treston Lizanne M
Bought by
Norwest Mtg Inc
Purchase Details
Closed on
Sep 26, 1995
Sold by
Treston John G
Bought by
Treston Lizanne M
Purchase Details
Closed on
Feb 25, 1994
Sold by
Kaufman & Broad Of Nevada Inc
Bought by
Treston John G and Treston Lizanne M
Home Financials for this Owner
Home Financials are based on the most recent Mortgage that was taken out on this home.
Original Mortgage
$119,325
Interest Rate
6.98%
Mortgage Type
FHA
Create a Home Valuation Report for This Property
The Home Valuation Report is an in-depth analysis detailing your home's value as well as a comparison with similar homes in the area
Home Values in the Area
Average Home Value in this Area
Purchase History
| Date | Buyer | Sale Price | Title Company |
|---|---|---|---|
| Laforga Daisy | $138,000 | Lsi Title Agency Inc | |
| Morequity Inc | $326,297 | Fidelity National Default So | |
| Rodriguez Richard | -- | Chicago Title | |
| Rodriguez Richard | -- | Nevada Title Company | |
| Rodriguez Richard J | $152,000 | Lawyers Title | |
| Taylor Justina D | -- | Lawyers Title | |
| Lewis Justina D | -- | Land Title | |
| Hud | -- | Ati Title | |
| Norwest Mtg Inc | $128,628 | Ati Title | |
| Treston Lizanne M | -- | -- | |
| Treston John G | $120,500 | First American Title Company |
Source: Public Records
Mortgage History
| Date | Status | Borrower | Loan Amount |
|---|---|---|---|
| Open | Laforga Daisy | $110,400 | |
| Previous Owner | Rodriguez Richard | $256,000 | |
| Previous Owner | Rodriguez Richard | $264,000 | |
| Previous Owner | Rodriguez Richard J | $136,800 | |
| Previous Owner | Lewis Justina D | $118,045 | |
| Previous Owner | Treston John G | $119,325 | |
| Closed | Rodriguez Richard J | $7,600 |
Source: Public Records
Tax History Compared to Growth
Tax History
| Year | Tax Paid | Tax Assessment Tax Assessment Total Assessment is a certain percentage of the fair market value that is determined by local assessors to be the total taxable value of land and additions on the property. | Land | Improvement |
|---|---|---|---|---|
| 2025 | $1,650 | $86,459 | $37,100 | $49,359 |
| 2024 | $1,602 | $86,459 | $37,100 | $49,359 |
| 2023 | $1,602 | $79,449 | $32,375 | $47,074 |
| 2022 | $1,556 | $71,191 | $28,000 | $43,191 |
| 2021 | $1,511 | $65,802 | $24,500 | $41,302 |
| 2020 | $1,464 | $65,194 | $24,150 | $41,044 |
| 2019 | $1,446 | $60,841 | $20,300 | $40,541 |
| 2018 | $1,380 | $56,174 | $17,150 | $39,024 |
| 2017 | $1,647 | $56,804 | $17,150 | $39,654 |
| 2016 | $1,292 | $51,436 | $11,550 | $39,886 |
| 2015 | $1,289 | $49,599 | $10,150 | $39,449 |
| 2014 | $1,251 | $43,986 | $8,050 | $35,936 |
Source: Public Records
Map
Nearby Homes
- 2494 Via di Autostrada
- 37 Bishopsgate Terrace
- 2427 Worchester Rd
- 2505 Cortina Ave
- 6 High Sierra Dr
- 2412 Eagleridge Dr
- 58 Pleasant Dale Dr
- 36 Tidwell Ln
- 2458 Tour Edition Dr
- 107 Tapatio St Unit 83
- 2561 Diplomacy Pointe Ct
- 247 Integrity Ridge Dr
- 43 Fantasia Ln
- 126 Montclair Dr
- 124 Tapatio St
- 112 Wynntry Dr
- 2802 Camelback Ln
- 2201 Ramsgate Dr Unit 1127
- 2201 Ramsgate Dr Unit 923
- 2201 Ramsgate Dr Unit 816
- 18 Via de Pescara
- 2453 Via de Cortona Unit 9999
- 2453 Via de Cortona
- 21 Rue de Parc
- 19 Rue de Parc
- 16 Via de Pescara
- 2455 Via de Cortona
- 23 Rue de Parc
- 17 Rue de Parc
- 2457 Via de Cortona
- 2456 Via de Cortona
- 2450 Avenida Cortes
- 2448 Avenida Cortes
- 2454 Avenida Cortes
- 25 Rue de Parc
- 2459 Via de Cortona
- 2458 Via de Cortona
- 2446 Avenida Cortes
- 12 Via de Pescara