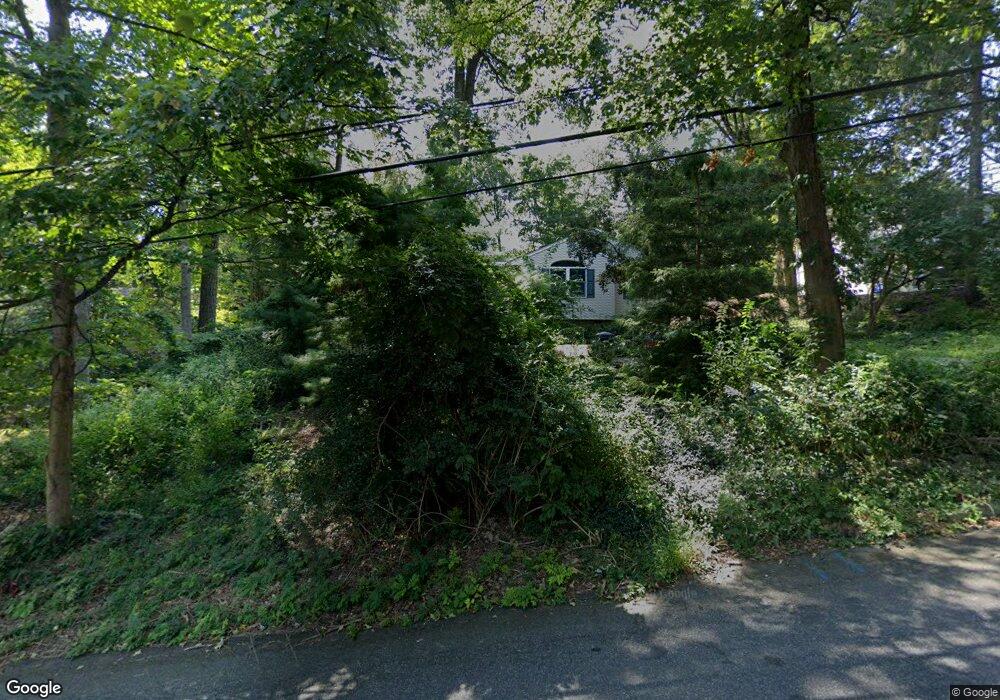
20 W Main St High Bridge, NJ 08829
Estimated Value: $501,000 - $560,000
--
Bed
--
Bath
1,785
Sq Ft
$299/Sq Ft
Est. Value
About This Home
This home is located at 20 W Main St, High Bridge, NJ 08829 and is currently estimated at $533,902, approximately $299 per square foot. 20 W Main St is a home located in Hunterdon County with nearby schools including High Bridge Elementary School, High Bridge Middle School, and Voorhees High School.
Ownership History
Date
Name
Owned For
Owner Type
Purchase Details
Closed on
Dec 27, 2019
Sold by
Bruton Emily and Estate Of Charles Bruton
Bought by
Bruton Emily
Current Estimated Value
Purchase Details
Closed on
Jul 1, 2004
Sold by
Lucash James and Lucash Michelle
Bought by
Downey Russell and Downey Patricia
Purchase Details
Closed on
Apr 24, 2002
Sold by
Gold Harvey I
Bought by
Lucash James and Lucash Michelle
Home Financials for this Owner
Home Financials are based on the most recent Mortgage that was taken out on this home.
Original Mortgage
$146,000
Interest Rate
7.13%
Create a Home Valuation Report for This Property
The Home Valuation Report is an in-depth analysis detailing your home's value as well as a comparison with similar homes in the area
Home Values in the Area
Average Home Value in this Area
Purchase History
| Date | Buyer | Sale Price | Title Company |
|---|---|---|---|
| Bruton Emily | -- | None Available | |
| Downey Russell | $350,000 | -- | |
| Lucash James | $255,000 | -- |
Source: Public Records
Mortgage History
| Date | Status | Borrower | Loan Amount |
|---|---|---|---|
| Previous Owner | Lucash James | $146,000 |
Source: Public Records
Tax History Compared to Growth
Tax History
| Year | Tax Paid | Tax Assessment Tax Assessment Total Assessment is a certain percentage of the fair market value that is determined by local assessors to be the total taxable value of land and additions on the property. | Land | Improvement |
|---|---|---|---|---|
| 2025 | $10,938 | $301,800 | $147,800 | $154,000 |
| 2024 | $9,675 | $335,100 | $139,500 | $195,600 |
| 2023 | $9,675 | $244,700 | $97,000 | $147,700 |
| 2022 | $10,455 | $245,700 | $97,000 | $148,700 |
| 2021 | $10,249 | $246,200 | $97,000 | $149,200 |
| 2020 | $10,135 | $247,200 | $97,000 | $150,200 |
| 2019 | $10,249 | $248,100 | $97,000 | $151,100 |
| 2018 | $9,872 | $249,100 | $97,000 | $152,100 |
| 2017 | $9,712 | $252,000 | $97,000 | $155,000 |
| 2016 | $9,599 | $252,000 | $97,000 | $155,000 |
| 2015 | $9,339 | $252,000 | $97,000 | $155,000 |
| 2014 | $11,076 | $323,000 | $140,100 | $182,900 |
Source: Public Records
Map
Nearby Homes