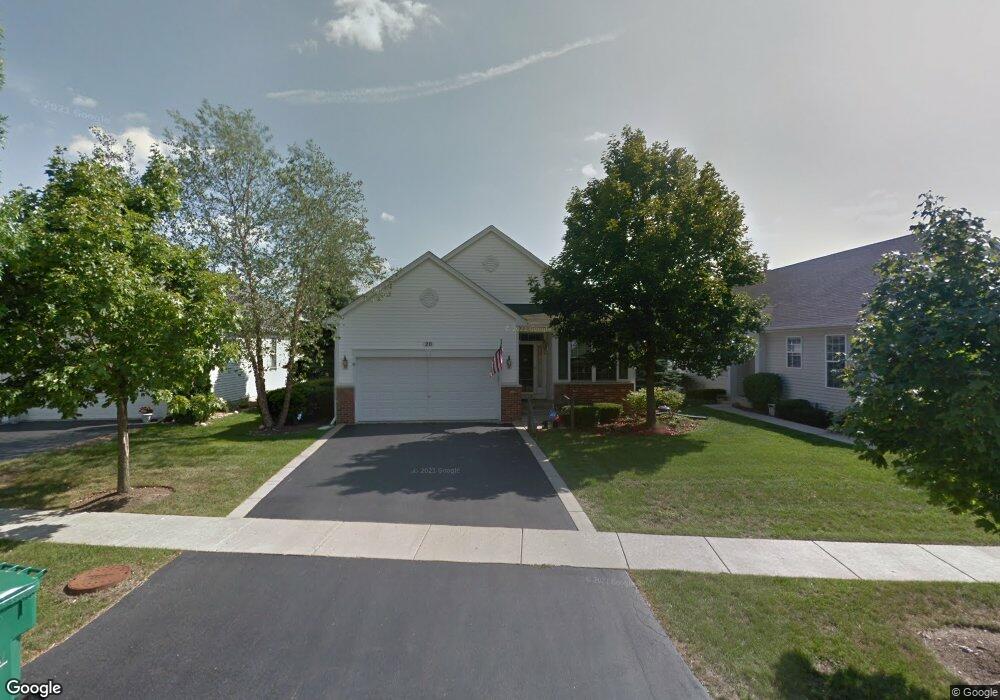
20 W Vandermeer Dr Unit 3 Antioch, IL 60002
Estimated Value: $306,000 - $334,000
3
Beds
3
Baths
1,482
Sq Ft
$217/Sq Ft
Est. Value
About This Home
This home is located at 20 W Vandermeer Dr Unit 3, Antioch, IL 60002 and is currently estimated at $321,943, approximately $217 per square foot. 20 W Vandermeer Dr Unit 3 is a home located in Lake County with nearby schools including Antioch Community High School.
Ownership History
Date
Name
Owned For
Owner Type
Purchase Details
Closed on
Jan 14, 2011
Sold by
Swanson Barbara J and Estate Of Harry W Ewert
Bought by
Przyborski Eric James and Ly Lymeng
Current Estimated Value
Home Financials for this Owner
Home Financials are based on the most recent Mortgage that was taken out on this home.
Original Mortgage
$183,870
Outstanding Balance
$124,575
Interest Rate
4.65%
Mortgage Type
VA
Estimated Equity
$197,368
Purchase Details
Closed on
Aug 6, 2009
Sold by
Ewert Harry W
Bought by
Ewert Harry W
Purchase Details
Closed on
Jan 12, 2009
Sold by
Ewert Linda K
Bought by
Ewert Harry W
Purchase Details
Closed on
Jan 8, 2003
Sold by
The Ryland Group Inc
Bought by
Ewert Harry W and Ewert Linda K
Home Financials for this Owner
Home Financials are based on the most recent Mortgage that was taken out on this home.
Original Mortgage
$80,000
Interest Rate
5.86%
Purchase Details
Closed on
Jul 31, 2000
Sold by
The Ryland Group Inc
Bought by
Rhone Inc
Create a Home Valuation Report for This Property
The Home Valuation Report is an in-depth analysis detailing your home's value as well as a comparison with similar homes in the area
Home Values in the Area
Average Home Value in this Area
Purchase History
| Date | Buyer | Sale Price | Title Company |
|---|---|---|---|
| Przyborski Eric James | $180,000 | First American Title | |
| Ewert Harry W | -- | None Available | |
| Ewert Harry W | -- | First American Title | |
| Ewert Harry W | $256,500 | Ticor | |
| Rhone Inc | $233,000 | -- |
Source: Public Records
Mortgage History
| Date | Status | Borrower | Loan Amount |
|---|---|---|---|
| Open | Przyborski Eric James | $183,870 | |
| Previous Owner | Ewert Harry W | $80,000 |
Source: Public Records
Tax History Compared to Growth
Tax History
| Year | Tax Paid | Tax Assessment Tax Assessment Total Assessment is a certain percentage of the fair market value that is determined by local assessors to be the total taxable value of land and additions on the property. | Land | Improvement |
|---|---|---|---|---|
| 2024 | $7,143 | $86,987 | $6,815 | $80,172 |
| 2023 | $7,029 | $77,889 | $6,102 | $71,787 |
| 2022 | $7,029 | $73,584 | $7,948 | $65,636 |
| 2021 | $6,467 | $68,661 | $7,416 | $61,245 |
| 2020 | $6,314 | $66,765 | $7,211 | $59,554 |
| 2019 | $6,379 | $63,847 | $6,896 | $56,951 |
| 2018 | $5,688 | $59,292 | $12,100 | $47,192 |
| 2017 | $5,613 | $56,436 | $11,517 | $44,919 |
| 2016 | $5,442 | $54,465 | $11,115 | $43,350 |
| 2015 | $5,606 | $53,079 | $10,832 | $42,247 |
| 2014 | $6,268 | $59,994 | $15,908 | $44,086 |
| 2012 | $5,800 | $59,994 | $15,908 | $44,086 |
Source: Public Records
Map
Nearby Homes
- 73 W Old Mill Trail
- 45 Van Dyke Dr
- 324 Elmwood Ln
- 44 Burnette Dr
- 56 Burnette Dr
- 52 Burnette Dr
- 168 Tree Line
- 49 Burnette Dr
- 68 Burnette Dr
- 672 Garys Dr
- 197 Maplewood Dr
- 327 Lakewood Dr
- 394 Birchwood Dr
- 188 Oakwood Dr
- 152 E Depot St
- 269 Lakewood Dr
- 770 Anita Ave
- Lt35 128th St
- 104 Lakewood Dr
- 12719 234th Ave
- 24 W Vandermeer Dr Unit 3
- 16 W Vandermeer Dr
- 30 W Vandermeer Dr Unit 3
- 23 W Hague Dr
- 17 W Hague Dr
- 29 W Hague Dr
- 36 W Vandermeer Dr
- 35 W Hague Dr
- 15 W Vandermeer Dr
- 21 W Vandermeer Dr
- 2 E Vandermeer Dr
- 11 W Vandermeer Dr
- 1 E Hague Dr Unit 3
- 27 W Vandermeer Dr Unit 3
- 33 W Vandermeer Dr
- 43 W Hague Dr Unit 3
- 39 W Vandermeer Dr Unit 3
- 5 E Hague Dr Unit 3
- 6 E Vandermeer Dr Unit 3
- 1 E Vandermeer Dr