
Seller's Agent in 2021
Amy Brunet
Brunet and Company Real Estate
(860) 234-0434
18 in this area
135 Total Sales
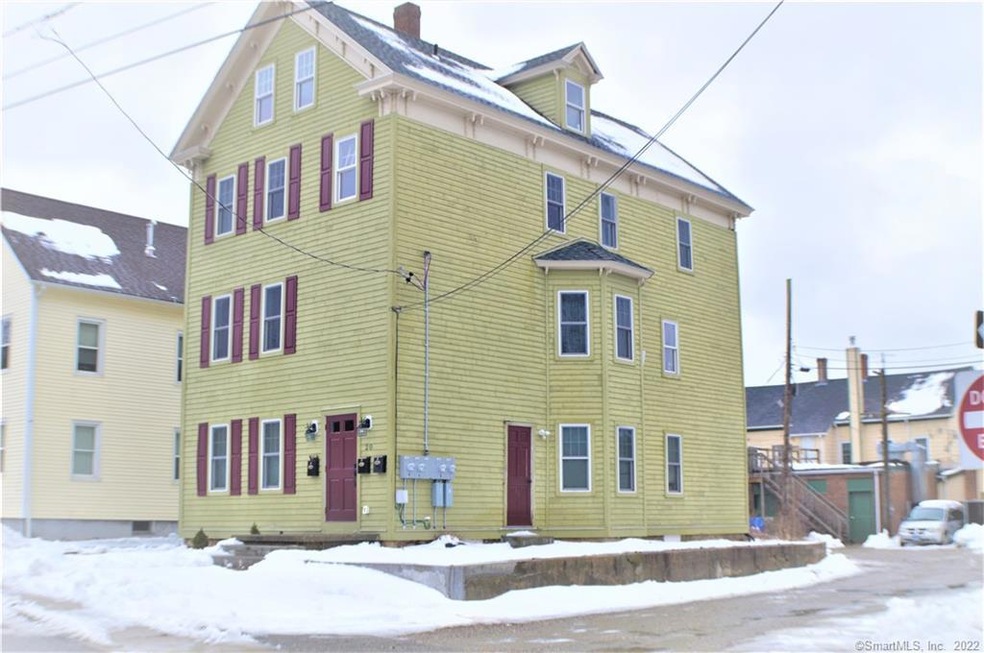
Beautiful Ideal 3 family located in Killingly. Building was completely renovated in 2019. Everything is new down to stud's inside. New wiring/plumbing/drywall/flooring/kitchen/appliances/etc. Currently fully rented and super easy to manage. New roof, completely painted outside/inside. Pictures are of when renovations were complete. Tenants now in place. Come see 20 water st and make it your next home!
Last Agent to Sell the Property
Hammett Real Estate License #RES.0796872 Listed on: 02/06/2021
| Date | Type | Sale Price | Title Company |
|---|---|---|---|
| Warranty Deed | $289,900 | None Available | |
| Warranty Deed | $289,900 | None Available | |
| Warranty Deed | $289,900 | None Available | |
| Quit Claim Deed | -- | None Available | |
| Quit Claim Deed | -- | None Available | |
| Quit Claim Deed | -- | None Available | |
| Warranty Deed | -- | None Available | |
| Warranty Deed | -- | None Available | |
| Warranty Deed | -- | None Available | |
| Quit Claim Deed | -- | -- | |
| Quit Claim Deed | -- | -- | |
| Quit Claim Deed | -- | -- | |
| Warranty Deed | $30,000 | -- | |
| Warranty Deed | $30,000 | -- | |
| Quit Claim Deed | -- | -- | |
| Quit Claim Deed | -- | -- | |
| Deed | $120,000 | -- |
| Date | Status | Loan Amount | Loan Type |
|---|---|---|---|
| Open | $217,425 | Purchase Money Mortgage | |
| Closed | $217,425 | Purchase Money Mortgage | |
| Previous Owner | $187,425 | Balloon | |
| Previous Owner | $650,000 | Stand Alone Refi Refinance Of Original Loan | |
| Previous Owner | $145,000 | Stand Alone Refi Refinance Of Original Loan | |
| Previous Owner | $130,000 | New Conventional |
| Date | Event | Price | Change | Sq Ft Price |
|---|---|---|---|---|
| 02/10/2025 02/10/25 | Off Market | -- | -- | -- |
| 02/06/2025 02/06/25 | For Rent | $1,800 | 0.0% | -- |
| 01/21/2025 01/21/25 | For Rent | -- | -- | -- |
| 01/19/2025 01/19/25 | For Rent | $1,800 | 0.0% | -- |
| 11/05/2021 11/05/21 | Sold | $289,900 | 0.0% | $116 / Sq Ft |
| 07/28/2021 07/28/21 | Price Changed | $289,900 | +5.4% | $116 / Sq Ft |
| 07/11/2021 07/11/21 | For Sale | $275,000 | +10.0% | $110 / Sq Ft |
| 04/16/2021 04/16/21 | Sold | $249,900 | 0.0% | $100 / Sq Ft |
| 02/07/2021 02/07/21 | Pending | -- | -- | -- |
| 02/06/2021 02/06/21 | For Sale | $249,900 | +733.0% | $100 / Sq Ft |
| 10/30/2018 10/30/18 | Sold | $30,000 | -33.2% | $6 / Sq Ft |
| 07/02/2018 07/02/18 | Pending | -- | -- | -- |
| 07/02/2018 07/02/18 | For Sale | $44,900 | +49.7% | $9 / Sq Ft |
| 05/24/2018 05/24/18 | Off Market | $30,000 | -- | -- |
| 04/13/2018 04/13/18 | For Sale | $44,900 | -- | $9 / Sq Ft |
| Year | Tax Paid | Tax Assessment Tax Assessment Total Assessment is a certain percentage of the fair market value that is determined by local assessors to be the total taxable value of land and additions on the property. | Land | Improvement |
|---|---|---|---|---|
| 2025 | $5,597 | $223,430 | $19,660 | $203,770 |
| 2024 | $5,343 | $223,430 | $19,660 | $203,770 |
| 2023 | $4,039 | $125,860 | $6,080 | $119,780 |
| 2022 | $3,800 | $125,860 | $6,090 | $119,770 |
| 2021 | $917 | $30,380 | $6,090 | $24,290 |
| 2020 | $3,737 | $125,860 | $6,090 | $119,770 |
| 2019 | $912 | $30,380 | $6,090 | $24,290 |
| 2017 | $937 | $29,050 | $6,090 | $22,960 |
| 2016 | $937 | $29,050 | $6,090 | $22,960 |
| 2015 | $918 | $29,050 | $6,090 | $22,960 |
| 2014 | $896 | $29,050 | $6,090 | $22,960 |
Seller's Agent in 2021
Amy Brunet
Brunet and Company Real Estate
(860) 234-0434
18 in this area
135 Total Sales
Seller's Agent in 2021
Brian Hammett
Hammett Real Estate
(860) 303-3400
6 in this area
45 Total Sales
Buyer's Agent in 2021
Nicole Garbutt
RE/MAX
(860) 933-4304
11 in this area
123 Total Sales
Seller's Agent in 2018
Ryan Brown
Executive Real Estate
(860) 916-6048
36 Total Sales
Source: SmartMLS
MLS Number: 170370992
APN: KILL-000198-000000-000058
Disclaimer: Certain information contained herein is derived from information provided by parties other than Homes.com. All information provided is deemed reliable, but is not guaranteed to be accurate and should be independently verified.
![]() IDX information is provided exclusively for personal, non-commercial use, and may not be used for any purpose other than to identify prospective properties consumers may be interested in purchasing. Information is deemed reliable but not guaranteed.
IDX information is provided exclusively for personal, non-commercial use, and may not be used for any purpose other than to identify prospective properties consumers may be interested in purchasing. Information is deemed reliable but not guaranteed.