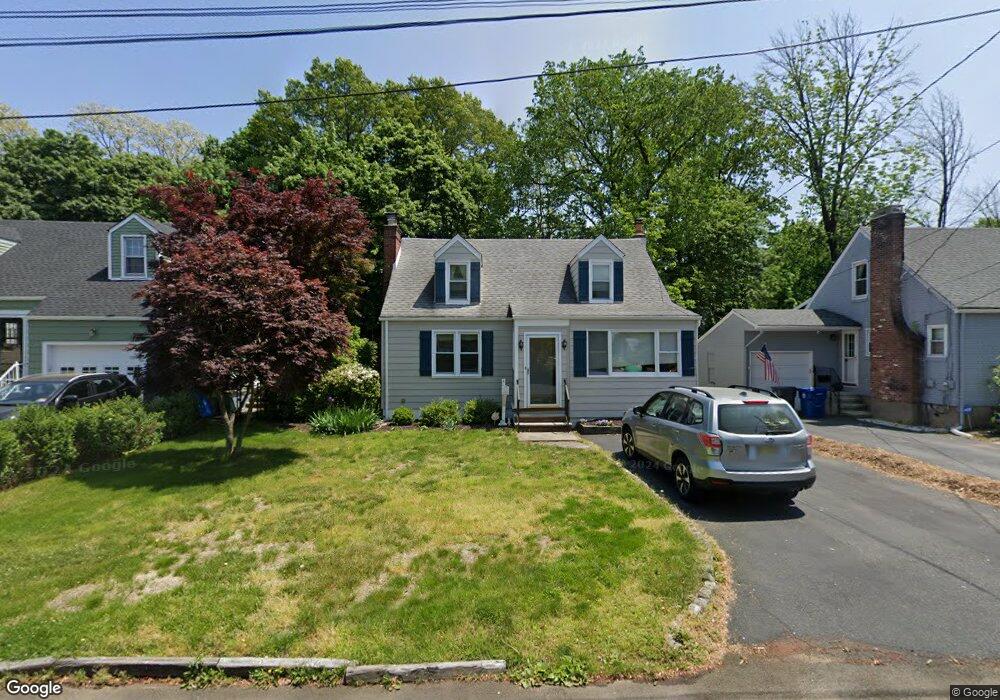
20 Watnong Rd Morris Plains, NJ 07950
Estimated Value: $617,000 - $772,000
3
Beds
2
Baths
2,044
Sq Ft
$338/Sq Ft
Est. Value
About This Home
This home is located at 20 Watnong Rd, Morris Plains, NJ 07950 and is currently estimated at $690,199, approximately $337 per square foot. 20 Watnong Rd is a home located in Morris County with nearby schools including Hillcrest School, Thomas Jefferson School, and Alfred Vail School.
Ownership History
Date
Name
Owned For
Owner Type
Purchase Details
Closed on
Sep 25, 2010
Sold by
Bilheimer Scott W and Bilheimer Cathleen M
Bought by
Bilheimer Scott W and Bilheimer Cathleen M
Current Estimated Value
Purchase Details
Closed on
Sep 3, 2008
Sold by
Burakoff Pamela and Burakoff Michael
Bought by
Bilheimer Scott W and Brennan Cathleen M
Home Financials for this Owner
Home Financials are based on the most recent Mortgage that was taken out on this home.
Original Mortgage
$306,800
Outstanding Balance
$204,260
Interest Rate
6.54%
Mortgage Type
Purchase Money Mortgage
Estimated Equity
$485,939
Create a Home Valuation Report for This Property
The Home Valuation Report is an in-depth analysis detailing your home's value as well as a comparison with similar homes in the area
Home Values in the Area
Average Home Value in this Area
Purchase History
| Date | Buyer | Sale Price | Title Company |
|---|---|---|---|
| Bilheimer Scott W | -- | Transnation Title Ins Co | |
| Bilheimer Scott W | $383,500 | Transnation Title Ins Co |
Source: Public Records
Mortgage History
| Date | Status | Borrower | Loan Amount |
|---|---|---|---|
| Open | Bilheimer Scott W | $306,800 |
Source: Public Records
Tax History Compared to Growth
Tax History
| Year | Tax Paid | Tax Assessment Tax Assessment Total Assessment is a certain percentage of the fair market value that is determined by local assessors to be the total taxable value of land and additions on the property. | Land | Improvement |
|---|---|---|---|---|
| 2025 | $7,183 | $358,800 | $205,200 | $153,600 |
| 2024 | $7,194 | $358,800 | $205,200 | $153,600 |
| 2023 | $7,194 | $358,800 | $205,200 | $153,600 |
| 2022 | $6,753 | $358,800 | $205,200 | $153,600 |
| 2021 | $6,577 | $353,200 | $205,200 | $148,000 |
| 2020 | $6,577 | $353,200 | $205,200 | $148,000 |
| 2019 | $6,474 | $353,200 | $205,200 | $148,000 |
| 2018 | $6,404 | $353,200 | $205,200 | $148,000 |
| 2017 | $6,361 | $353,200 | $205,200 | $148,000 |
| 2016 | $6,191 | $349,200 | $205,200 | $144,000 |
| 2015 | $5,298 | $208,900 | $122,300 | $86,600 |
| 2014 | $5,229 | $208,900 | $122,300 | $86,600 |
Source: Public Records
Map
Nearby Homes