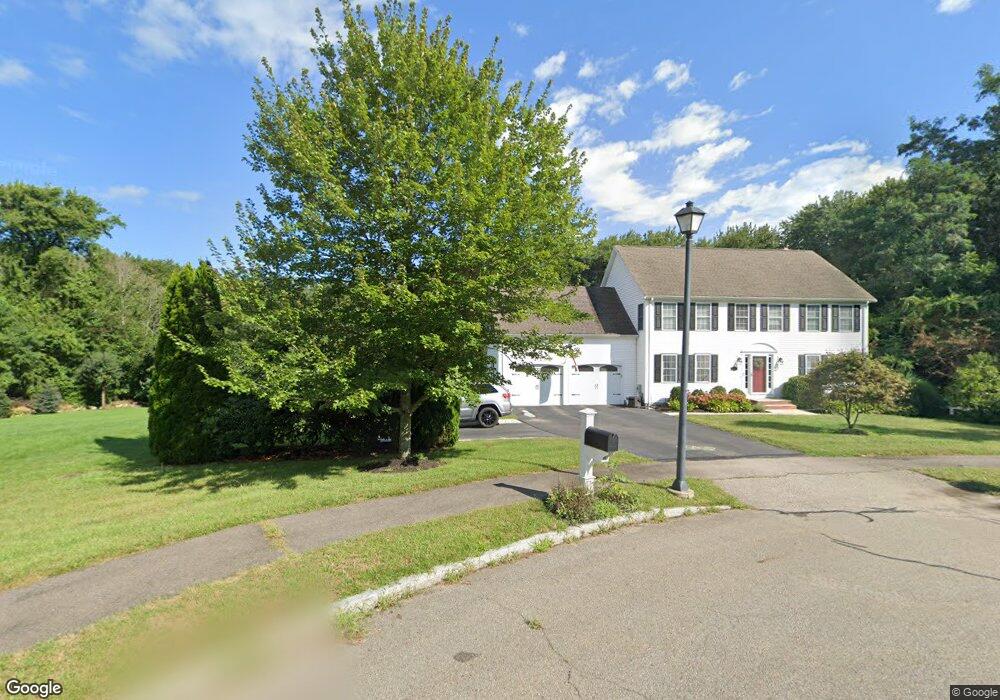
20 Wentworth Rd Wrentham, MA 02093
Sheldonville NeighborhoodEstimated Value: $966,000 - $1,117,352
5
Beds
4
Baths
3,488
Sq Ft
$302/Sq Ft
Est. Value
About This Home
This home is located at 20 Wentworth Rd, Wrentham, MA 02093 and is currently estimated at $1,054,088, approximately $302 per square foot. 20 Wentworth Rd is a home located in Norfolk County with nearby schools including Delaney Elementary School, Charles E Roderick, and Mercymount Country Day School.
Ownership History
Date
Name
Owned For
Owner Type
Purchase Details
Closed on
Aug 30, 2005
Sold by
Caf Rt and Caffarelli Joseph A
Bought by
Jacobs Craig M and Jacobs Shannon M
Current Estimated Value
Home Financials for this Owner
Home Financials are based on the most recent Mortgage that was taken out on this home.
Original Mortgage
$551,000
Outstanding Balance
$291,630
Interest Rate
5.68%
Mortgage Type
Purchase Money Mortgage
Estimated Equity
$762,458
Create a Home Valuation Report for This Property
The Home Valuation Report is an in-depth analysis detailing your home's value as well as a comparison with similar homes in the area
Home Values in the Area
Average Home Value in this Area
Purchase History
| Date | Buyer | Sale Price | Title Company |
|---|---|---|---|
| Jacobs Craig M | $580,000 | -- |
Source: Public Records
Mortgage History
| Date | Status | Borrower | Loan Amount |
|---|---|---|---|
| Open | Jacobs Craig M | $551,000 |
Source: Public Records
Tax History Compared to Growth
Tax History
| Year | Tax Paid | Tax Assessment Tax Assessment Total Assessment is a certain percentage of the fair market value that is determined by local assessors to be the total taxable value of land and additions on the property. | Land | Improvement |
|---|---|---|---|---|
| 2025 | $11,170 | $963,800 | $288,800 | $675,000 |
| 2024 | $10,565 | $880,400 | $288,800 | $591,600 |
| 2023 | $10,531 | $834,500 | $262,700 | $571,800 |
| 2022 | $10,427 | $762,800 | $255,900 | $506,900 |
| 2021 | $9,935 | $706,100 | $239,200 | $466,900 |
| 2020 | $8,664 | $608,000 | $182,800 | $425,200 |
| 2019 | $8,314 | $588,800 | $182,800 | $406,000 |
| 2018 | $7,638 | $536,400 | $182,600 | $353,800 |
| 2017 | $7,493 | $525,800 | $179,000 | $346,800 |
| 2016 | $7,051 | $493,800 | $173,900 | $319,900 |
| 2015 | $6,725 | $448,900 | $167,100 | $281,800 |
| 2014 | $6,614 | $432,000 | $160,700 | $271,300 |
Source: Public Records
Map
Nearby Homes
- 50 Green St
- 80 Carriage House Ln
- 440 Chestnut St
- 955 Summer St
- 1204 South St
- 1222 South St
- 19 Chestnut Lot 0
- 791 South St Unit 5
- 11 Amber Dr
- 4 Munroe Dr
- 12 Grant St
- 6 Woodchester Rd
- Lot 1 - Blueberry 2 Car Plan at King Philip Estates
- Lot 8 - Blueberry 2 Car Plan at King Philip Estates
- Lot 5 - Hughes 2 car Plan at King Philip Estates
- Lot 6 - Blueberry 3 Car Plan at King Philip Estates
- Lot 2 - Camden 2 Car Plan at King Philip Estates
- Lot 7 - Cedar Plan at King Philip Estates
- Lot 4 - Hemingway 2 Car Plan at King Philip Estates
- Lot 3 - Blueberry 2 Car Plan at King Philip Estates