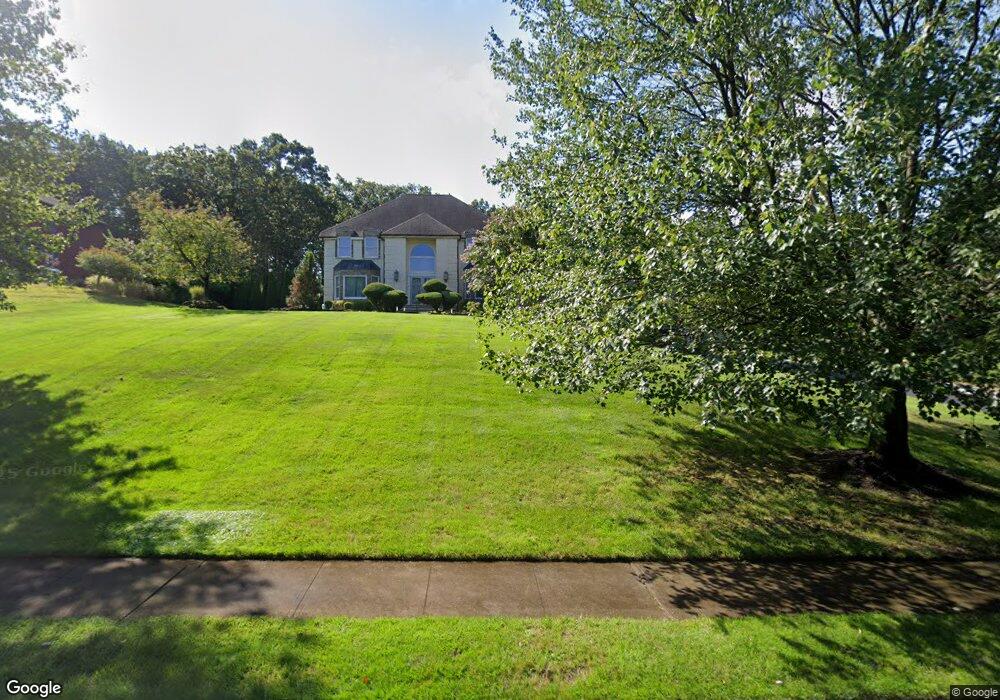
20 Wesley Ct Eatontown, NJ 07724
Estimated Value: $1,126,000 - $1,395,357
6
Beds
3
Baths
4,032
Sq Ft
$324/Sq Ft
Est. Value
About This Home
This home is located at 20 Wesley Ct, Eatontown, NJ 07724 and is currently estimated at $1,306,839, approximately $324 per square foot. 20 Wesley Ct is a home located in Monmouth County with nearby schools including Woodmere Elementary School, Memorial Middle School, and Monmouth Regional High School.
Ownership History
Date
Name
Owned For
Owner Type
Purchase Details
Closed on
Jul 8, 1996
Sold by
Malgieri John
Bought by
Daly Daniel and Daly Angela
Current Estimated Value
Home Financials for this Owner
Home Financials are based on the most recent Mortgage that was taken out on this home.
Original Mortgage
$200,000
Outstanding Balance
$14,126
Interest Rate
7.98%
Estimated Equity
$1,292,713
Create a Home Valuation Report for This Property
The Home Valuation Report is an in-depth analysis detailing your home's value as well as a comparison with similar homes in the area
Home Values in the Area
Average Home Value in this Area
Purchase History
| Date | Buyer | Sale Price | Title Company |
|---|---|---|---|
| Daly Daniel | $360,000 | -- |
Source: Public Records
Mortgage History
| Date | Status | Borrower | Loan Amount |
|---|---|---|---|
| Open | Daly Daniel | $200,000 |
Source: Public Records
Tax History Compared to Growth
Tax History
| Year | Tax Paid | Tax Assessment Tax Assessment Total Assessment is a certain percentage of the fair market value that is determined by local assessors to be the total taxable value of land and additions on the property. | Land | Improvement |
|---|---|---|---|---|
| 2025 | $19,974 | $1,019,200 | $355,500 | $663,700 |
| 2024 | $18,965 | $1,067,000 | $324,700 | $742,300 |
| 2023 | $18,965 | $962,200 | $284,700 | $677,500 |
| 2022 | $17,565 | $833,100 | $224,400 | $608,700 |
| 2021 | $17,045 | $763,700 | $219,000 | $544,700 |
| 2020 | $17,045 | $747,600 | $219,000 | $528,600 |
| 2019 | $16,909 | $742,600 | $199,000 | $543,600 |
| 2018 | $16,226 | $702,100 | $189,000 | $513,100 |
| 2017 | $15,602 | $698,700 | $189,000 | $509,700 |
| 2016 | $15,235 | $697,900 | $179,000 | $518,900 |
| 2015 | $17,628 | $793,000 | $190,000 | $603,000 |
| 2014 | $15,907 | $705,100 | $170,000 | $535,100 |
Source: Public Records
Map
Nearby Homes