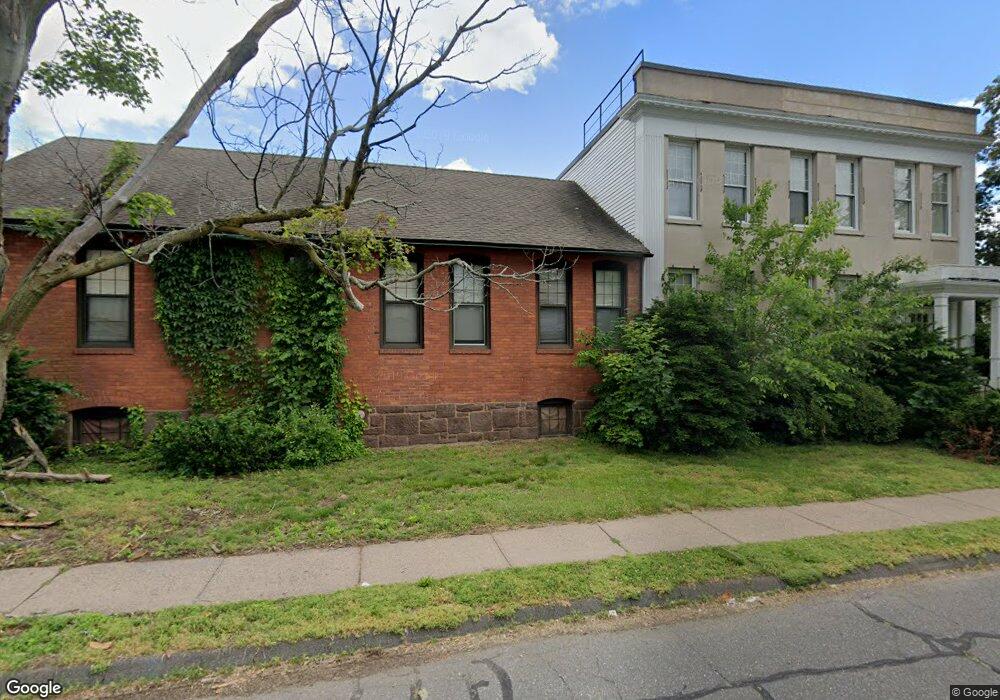
20 Westbrook St East Hartford, CT 06108
Estimated Value: $780,297
--
Bed
--
Bath
10,658
Sq Ft
$73/Sq Ft
Est. Value
About This Home
This home is located at 20 Westbrook St, East Hartford, CT 06108 and is currently estimated at $780,297, approximately $73 per square foot. 20 Westbrook St is a home located in Hartford County with nearby schools including Dr. John A. Langford School, East Hartford Middle School, and East Hartford High School.
Ownership History
Date
Name
Owned For
Owner Type
Purchase Details
Closed on
Dec 17, 2004
Sold by
Koteen Charles D
Bought by
Hdr Hldgs Llc
Current Estimated Value
Home Financials for this Owner
Home Financials are based on the most recent Mortgage that was taken out on this home.
Original Mortgage
$360,000
Interest Rate
5.68%
Mortgage Type
Commercial
Purchase Details
Closed on
Mar 16, 1989
Sold by
Product Identifictn
Bought by
Koteen Charles D
Create a Home Valuation Report for This Property
The Home Valuation Report is an in-depth analysis detailing your home's value as well as a comparison with similar homes in the area
Home Values in the Area
Average Home Value in this Area
Purchase History
| Date | Buyer | Sale Price | Title Company |
|---|---|---|---|
| Hdr Hldgs Llc | $432,000 | -- | |
| Hdr Hldgs Llc | $432,000 | -- | |
| Koteen Charles D | $443,000 | -- |
Source: Public Records
Mortgage History
| Date | Status | Borrower | Loan Amount |
|---|---|---|---|
| Closed | Koteen Charles D | $5,032,000 | |
| Closed | Koteen Charles D | $360,000 |
Source: Public Records
Tax History Compared to Growth
Tax History
| Year | Tax Paid | Tax Assessment Tax Assessment Total Assessment is a certain percentage of the fair market value that is determined by local assessors to be the total taxable value of land and additions on the property. | Land | Improvement |
|---|---|---|---|---|
| 2025 | $16,906 | $368,320 | $107,270 | $261,050 |
| 2024 | $16,206 | $368,320 | $78,930 | $289,390 |
| 2023 | $15,668 | $368,320 | $78,930 | $289,390 |
| 2022 | $15,101 | $368,320 | $78,930 | $289,390 |
| 2021 | $17,989 | $364,510 | $73,080 | $291,430 |
| 2020 | $18,196 | $364,510 | $73,080 | $291,430 |
| 2019 | $17,901 | $364,510 | $73,080 | $291,430 |
| 2018 | $17,373 | $364,510 | $73,080 | $291,430 |
| 2017 | $17,150 | $364,510 | $73,080 | $291,430 |
| 2016 | $17,405 | $379,519 | $73,080 | $306,439 |
| 2015 | $17,405 | $379,519 | $73,080 | $306,439 |
| 2014 | $17,230 | $379,519 | $73,080 | $306,439 |
Source: Public Records
Map
Nearby Homes
- 265 Burnside Ave
- 30 Oakwood St
- 10 Kenyon Place
- 33 Kenyon Place
- 453 Burnside Ave
- 181 Burnside Ave
- 51 Daniel St
- 506 Burnside Ave
- 98 Olmsted St
- 67 Laurel St
- 15 Michael Ave
- 1589 Main St
- 421 Tolland St
- 52 Burnside Ave
- 89 Henderson Dr
- 47 Elm St
- 22 Matthew Rd
- 39 Tiffany Rd
- 41 Bissell St
- 29 Joanne Dr Unit 29
- 18 Westbrook St
- 30 Westbrook St
- 3 Joseph St
- 21 Westbrook St
- 15 Westbrook St
- 25 Westbrook St
- 36 Westbrook St
- 4 Joseph St
- 29 Westbrook St
- 35 Westbrook St
- 7 Westbrook St
- 171 Tolland St
- 1 Bidwell St
- 181 Tolland St Unit 183
- 3 Bidwell St
- 360 Burnside Ave
- 169 Tolland St
- 284 Burnside Ave
- 290 Burnside Ave
- 26 Ann St