


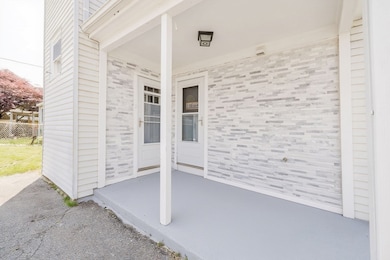
20 Wilcox St Fall River, MA 02724
Father Kelly NeighborhoodEstimated payment $3,217/month
Total Views
2,401
5
Beds
2
Baths
1,792
Sq Ft
$312
Price per Sq Ft
Highlights
- Granite Flooring
- Balcony
- Space Heater
- Deck
- Window Unit Cooling System
- 5-minute walk to Kelly Park
About This Home
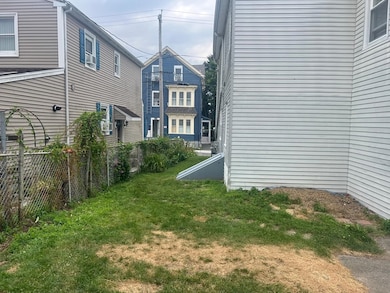
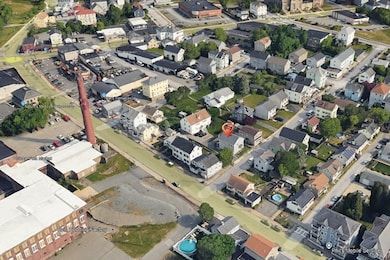
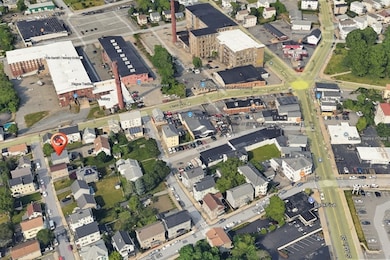
Well-maintained 2-family in Fall River’s desirable South End, ideal for both owner-occupants and investors. Each unit has a private entrance. The vacant first-floor unit offers 3 bedrooms, an eat-in kitchen with tile flooring, a bright hardwood living room, and a full bath—perfect for moving in or strong rental income. The second-floor unit features 2 bedrooms, an open living/dining layout, kitchen with breakfast bar, gas stove, unit space heater, ceiling fans, and an updated bath with jetted tub; currently rented for $1,700/month. Property highlights include a full basement with interior access and bulkhead, laundry hookups, ample storage, 3 electrical meters, 2 gas meters, and a private driveway for off-street parking. Convenient location near schools, shops, major roads, highway access, and the South Coast commuter rail/T station. A great opportunity to live in one unit while renting the other or add a solid investment to your portfolio. First floor available for showing immediately
Property Details
Home Type
- Multi-Family
Est. Annual Taxes
- $4,146
Year Built
- Built in 1930
Lot Details
- 2,940 Sq Ft Lot
Home Design
- Brick Foundation
- Rubber Roof
Interior Spaces
- 1,792 Sq Ft Home
- Property has 1 Level
- Granite Flooring
- Unfinished Basement
- Basement Fills Entire Space Under The House
- Range
Bedrooms and Bathrooms
- 5 Bedrooms
- 2 Full Bathrooms
Parking
- 4 Open Parking Spaces
- 4 Car Parking Spaces
- Off-Street Parking
Outdoor Features
- Balcony
- Deck
Utilities
- Window Unit Cooling System
- Space Heater
- 110 Volts
Community Details
- 2 Units
Listing and Financial Details
- Rent includes unit 1(water), unit 2(water)
- Tax Lot 1,773
- Assessor Parcel Number M:0G26 B:0000 L:0068,2826970
Map
Create a Home Valuation Report for This Property
The Home Valuation Report is an in-depth analysis detailing your home's value as well as a comparison with similar homes in the area
Home Values in the Area
Average Home Value in this Area
Tax History
| Year | Tax Paid | Tax Assessment Tax Assessment Total Assessment is a certain percentage of the fair market value that is determined by local assessors to be the total taxable value of land and additions on the property. | Land | Improvement |
|---|---|---|---|---|
| 2025 | $4,146 | $362,100 | $105,400 | $256,700 |
| 2024 | $3,817 | $332,200 | $101,500 | $230,700 |
| 2023 | $3,356 | $273,500 | $83,900 | $189,600 |
| 2022 | $3,120 | $247,200 | $79,900 | $167,300 |
| 2021 | $2,906 | $210,100 | $76,000 | $134,100 |
| 2020 | $2,640 | $182,700 | $74,900 | $107,800 |
| 2019 | $2,511 | $172,200 | $72,100 | $100,100 |
| 2018 | $2,421 | $165,600 | $78,100 | $87,500 |
| 2017 | $2,199 | $157,100 | $74,400 | $82,700 |
| 2016 | $2,179 | $159,900 | $79,200 | $80,700 |
| 2015 | $2,069 | $158,200 | $79,200 | $79,000 |
| 2014 | $2,051 | $163,000 | $76,900 | $86,100 |
Source: Public Records
Property History
| Date | Event | Price | List to Sale | Price per Sq Ft | Prior Sale |
|---|---|---|---|---|---|
| 12/31/2025 12/31/25 | Pending | -- | -- | -- | |
| 12/04/2025 12/04/25 | For Sale | $559,000 | +9.6% | $312 / Sq Ft | |
| 07/31/2025 07/31/25 | Sold | $510,000 | +6.5% | $285 / Sq Ft | View Prior Sale |
| 06/12/2025 06/12/25 | Pending | -- | -- | -- | |
| 06/07/2025 06/07/25 | For Sale | $479,000 | -- | $267 / Sq Ft |
Source: MLS Property Information Network (MLS PIN)
Purchase History
| Date | Type | Sale Price | Title Company |
|---|---|---|---|
| Quit Claim Deed | $510,000 | -- | |
| Deed | $510,000 | -- | |
| Deed | $150,000 | -- | |
| Deed | $150,000 | -- | |
| Deed | $150,000 | -- |
Source: Public Records
Mortgage History
| Date | Status | Loan Amount | Loan Type |
|---|---|---|---|
| Open | $382,500 | New Conventional | |
| Closed | $382,500 | New Conventional | |
| Previous Owner | $144,637 | Purchase Money Mortgage |
Source: Public Records
About the Listing Agent
Mina's Other Listings
Source: MLS Property Information Network (MLS PIN)
MLS Number: 73459869
APN: FALL-000026G-000000-000068
Disclaimer: Certain information contained herein is derived from information provided by parties other than Homes.com. All information provided is deemed reliable, but is not guaranteed to be accurate and should be independently verified.
![]() The property listing data and information, or the Images, set forth herein were provided to MLS Property Information Network, Inc. from third party sources, including sellers, lessors and public records, and were compiled by MLS Property Information Network, Inc. The property listing data and information, and the Images, are for the personal, non-commercial use of consumers having a good faith interest in purchasing or leasing listed properties of the type displayed to them and may not be used for any purpose other than to identify prospective properties which such consumers may have a good faith interest in purchasing or leasing. MLS Property Information Network, Inc. and its subscribers disclaim any and all representations and warranties as to the accuracy of the property listing data and information, or as to the accuracy of any of the Images, set forth herein.
The property listing data and information, or the Images, set forth herein were provided to MLS Property Information Network, Inc. from third party sources, including sellers, lessors and public records, and were compiled by MLS Property Information Network, Inc. The property listing data and information, and the Images, are for the personal, non-commercial use of consumers having a good faith interest in purchasing or leasing listed properties of the type displayed to them and may not be used for any purpose other than to identify prospective properties which such consumers may have a good faith interest in purchasing or leasing. MLS Property Information Network, Inc. and its subscribers disclaim any and all representations and warranties as to the accuracy of the property listing data and information, or as to the accuracy of any of the Images, set forth herein.
Nearby Homes
- 1334 S Main St
- 1273-1279 S Main St
- 234 Kilburn St
- 917 Dwelly St
- 464 Birch St
- 344-354 E Main St
- 1846 S Main St
- 609 King Philip St
- 1852 S Main St
- 219 Montaup St
- 71 Mystic St Unit 3
- 240 Montaup St
- 70 Brown St
- 82 Montaup St
- 245 Dwelly St
- 57 Larouche St
- 15 Higgins St
- 340 Vale St
- 310 King Philip St
- 355 Peckham St
Your Personal Tour Guide
Ask me questions while you tour the home.