Estimated Value: $222,000 - $245,897
--
Bed
2
Baths
1,228
Sq Ft
$191/Sq Ft
Est. Value
About This Home
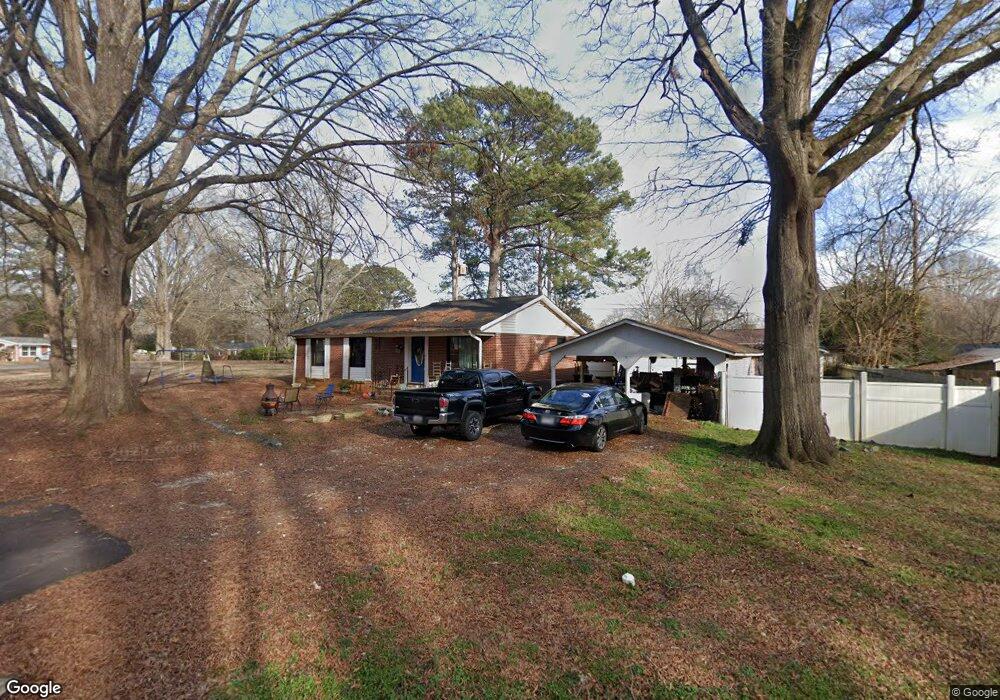
This home is located at 20 Willglow St Unit 12-B, York, SC 29745 and is currently estimated at $234,474, approximately $190 per square foot. 20 Willglow St Unit 12-B is a home located in York County with nearby schools including Cotton Belt Elementary School, York Intermediate School, and York Middle School.
Ownership History
Date
Name
Owned For
Owner Type
Purchase Details
Closed on
Jul 23, 2021
Sold by
Rice Elizabeth
Bought by
Taylor Brett S
Current Estimated Value
Home Financials for this Owner
Home Financials are based on the most recent Mortgage that was taken out on this home.
Original Mortgage
$140,000
Outstanding Balance
$127,087
Interest Rate
2.93%
Mortgage Type
New Conventional
Estimated Equity
$107,387
Purchase Details
Closed on
Jun 16, 2014
Sold by
Henson Ethel M
Bought by
Rice Elizabeth
Home Financials for this Owner
Home Financials are based on the most recent Mortgage that was taken out on this home.
Original Mortgage
$86,734
Interest Rate
4.23%
Mortgage Type
New Conventional
Purchase Details
Closed on
Jan 11, 2006
Sold by
Carbone James A
Bought by
Henson Ethel M
Purchase Details
Closed on
Nov 9, 2005
Sold by
Wray Geraldine B and Gibby Brenda B
Bought by
Carbone James A
Purchase Details
Closed on
May 24, 2005
Sold by
Wray Geraldine B and Gibby Brenda B
Bought by
Wray Geraldine B and Gibby Brenda B
Create a Home Valuation Report for This Property
The Home Valuation Report is an in-depth analysis detailing your home's value as well as a comparison with similar homes in the area
Home Values in the Area
Average Home Value in this Area
Purchase History
| Date | Buyer | Sale Price | Title Company |
|---|---|---|---|
| Taylor Brett S | $175,000 | None Available | |
| Rice Elizabeth | $85,000 | -- | |
| Henson Ethel M | $97,000 | None Available | |
| Carbone James A | $79,000 | -- | |
| Wray Geraldine B | -- | -- |
Source: Public Records
Mortgage History
| Date | Status | Borrower | Loan Amount |
|---|---|---|---|
| Open | Taylor Brett S | $140,000 | |
| Previous Owner | Rice Elizabeth | $86,734 |
Source: Public Records
Tax History Compared to Growth
Tax History
| Year | Tax Paid | Tax Assessment Tax Assessment Total Assessment is a certain percentage of the fair market value that is determined by local assessors to be the total taxable value of land and additions on the property. | Land | Improvement |
|---|---|---|---|---|
| 2024 | $1,278 | $6,731 | $640 | $6,091 |
| 2023 | $1,295 | $6,731 | $640 | $6,091 |
| 2022 | $1,302 | $6,731 | $640 | $6,091 |
| 2021 | -- | $3,358 | $609 | $2,749 |
| 2020 | $912 | $3,358 | $0 | $0 |
| 2019 | $853 | $2,920 | $0 | $0 |
| 2018 | $835 | $2,920 | $0 | $0 |
| 2017 | $788 | $2,920 | $0 | $0 |
| 2016 | $783 | $2,920 | $0 | $0 |
| 2014 | $1,998 | $2,920 | $640 | $2,280 |
| 2013 | $1,998 | $4,440 | $840 | $3,600 |
Source: Public Records
Map
Nearby Homes
- 0000 Georgia Ave
- 10 Georgia Ave
- 155 William St
- 171 William St
- 710 & 716 Miami Cir
- 30 Hunter St
- 218 E Madison St
- 741 Laguna Ave
- 13 Church St
- 105 Ross Cannon St Unit 104
- 235 E Jefferson St
- 306 Oak St Unit 18
- 2024 Crooked Oak Ln
- 50 Mcclain St
- 2038 Crooked Oak Ln Unit 16
- 408 Brick House Rd
- 416 Brick House Rd
- 538 Emily Katelyn Rd
- 326 Olympia Way
- 170 Canoga Ave
- 20 Willglow St
- 14 Willglow St
- 12 Willglow St
- 7 Cartwright St
- 7 Cartwright St
- 18 Willglow St Unit 12A
- 5 Cartwright St
- 9 Cartwright St
- 15 Willglow St
- 7 Catherine St
- 9 Catherine St
- 16 Willglow St
- 5 Catherine St
- 13 Willglow St
- 11 Catherine St
- 12 Cartwright St
- 10 Cartwright St
- 12 Catherine St
- 10 Willglow St
- 8 Cartwright St