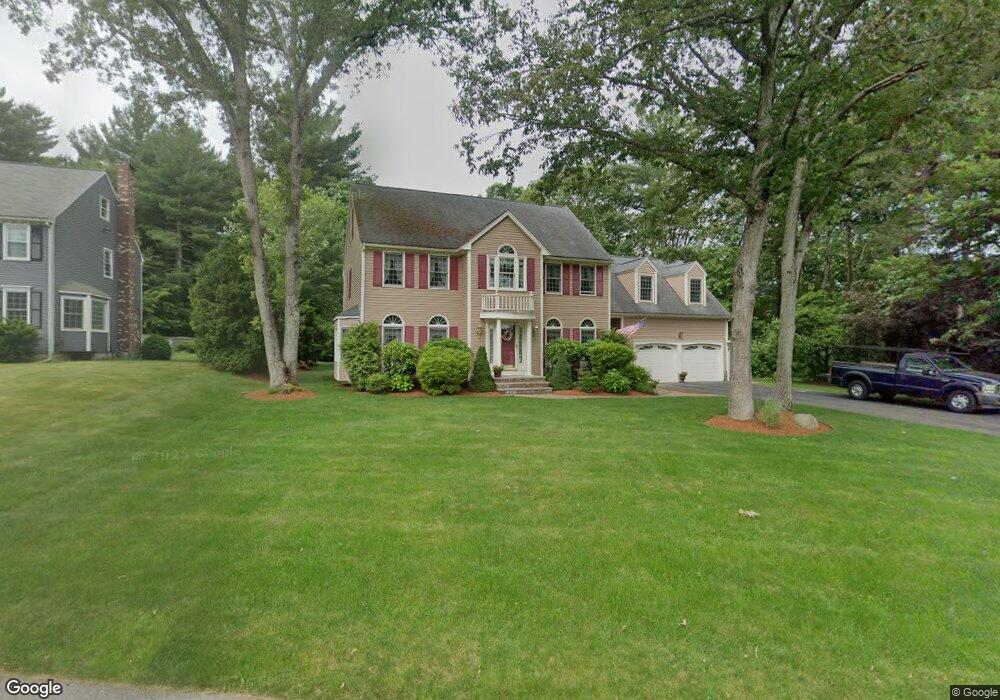
20 Windsor Rd East Walpole, MA 02032
Estimated Value: $1,210,945 - $1,314,000
4
Beds
3
Baths
3,064
Sq Ft
$416/Sq Ft
Est. Value
About This Home
This home is located at 20 Windsor Rd, East Walpole, MA 02032 and is currently estimated at $1,273,736, approximately $415 per square foot. 20 Windsor Rd is a home located in Norfolk County with nearby schools including Old Post Road School, Walpole Middle School, and Walpole High School.
Ownership History
Date
Name
Owned For
Owner Type
Purchase Details
Closed on
Oct 9, 2013
Sold by
Lovering Patricia A and Lovering Joel H
Bought by
Lovering T and Lovering Joel H
Current Estimated Value
Purchase Details
Closed on
Dec 28, 1992
Sold by
J E S E Constr Inc
Bought by
Lovering Joel H and Lovering Patricia A
Create a Home Valuation Report for This Property
The Home Valuation Report is an in-depth analysis detailing your home's value as well as a comparison with similar homes in the area
Home Values in the Area
Average Home Value in this Area
Purchase History
| Date | Buyer | Sale Price | Title Company |
|---|---|---|---|
| Lovering T | -- | -- | |
| Lovering Joel H | $296,000 | -- |
Source: Public Records
Mortgage History
| Date | Status | Borrower | Loan Amount |
|---|---|---|---|
| Previous Owner | Lovering Joel H | $402,000 | |
| Previous Owner | Lovering Joel H | $50,000 | |
| Previous Owner | Lovering Joel H | $408,000 |
Source: Public Records
Tax History Compared to Growth
Tax History
| Year | Tax Paid | Tax Assessment Tax Assessment Total Assessment is a certain percentage of the fair market value that is determined by local assessors to be the total taxable value of land and additions on the property. | Land | Improvement |
|---|---|---|---|---|
| 2025 | $13,967 | $1,088,600 | $369,200 | $719,400 |
| 2024 | $13,458 | $1,018,000 | $354,900 | $663,100 |
| 2023 | $12,475 | $898,100 | $308,600 | $589,500 |
| 2022 | $11,454 | $792,100 | $285,900 | $506,200 |
| 2021 | $11,280 | $760,100 | $269,600 | $490,500 |
| 2020 | $10,680 | $712,500 | $254,400 | $458,100 |
| 2019 | $10,624 | $703,600 | $264,200 | $439,400 |
| 2018 | $10,614 | $695,100 | $254,900 | $440,200 |
| 2017 | $10,325 | $673,500 | $245,200 | $428,300 |
| 2016 | $10,028 | $644,500 | $235,900 | $408,600 |
| 2015 | $9,759 | $621,600 | $224,800 | $396,800 |
| 2014 | $9,436 | $598,700 | $224,800 | $373,900 |
Source: Public Records
Map
Nearby Homes
- 2 Alexandra Way
- 486 Washington St
- 270 Moosehill Rd
- 363 - 367 Washington St
- 1 Palace Ct
- 52 Baker St
- 8 Rainbow Pond Dr Unit 8
- 11 Park Ln
- 7 Washington Green
- Unit 11 Powder House Ln Unit 11
- 8 Powder House Ln Unit 2
- Unit 12 Powder House Ln Unit 12
- Unit 3 Powder House Ln Unit 3
- 4403 Pennington Dr Unit 4403
- 305 Centre Ln
- 103 Centre Ln
- 291 Plimpton St
- 22 Coolidge Rd
- 635 Old Post Rd Unit 303
- 635 Old Post Rd Unit 302