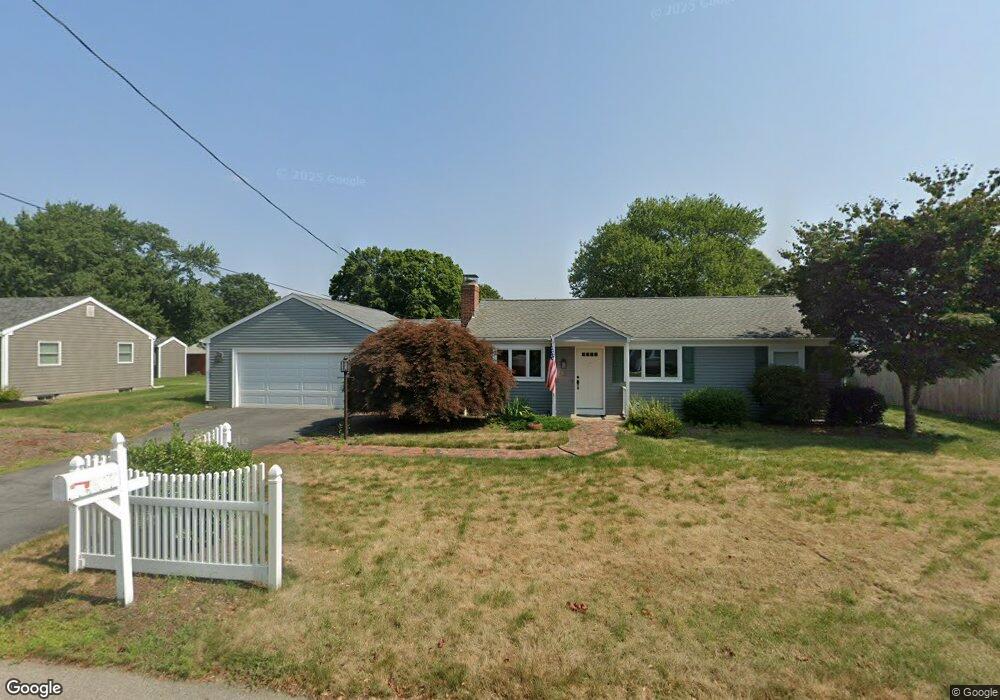
20 Winthrop St Seekonk, MA 02771
Monroes-South Seekonk NeighborhoodEstimated Value: $426,000 - $476,000
2
Beds
1
Bath
960
Sq Ft
$477/Sq Ft
Est. Value
About This Home
This home is located at 20 Winthrop St, Seekonk, MA 02771 and is currently estimated at $457,795, approximately $476 per square foot. 20 Winthrop St is a home located in Bristol County with nearby schools including Seekonk High School, St Mary Academy-Bay View, and Providence Country Day School.
Ownership History
Date
Name
Owned For
Owner Type
Purchase Details
Closed on
Mar 22, 2021
Sold by
Brennan Russell L and Brennan Sandra
Bought by
Brennan Ft
Current Estimated Value
Purchase Details
Closed on
Jan 1, 1982
Bought by
Brennan Russell L and Brennan Sandra
Create a Home Valuation Report for This Property
The Home Valuation Report is an in-depth analysis detailing your home's value as well as a comparison with similar homes in the area
Home Values in the Area
Average Home Value in this Area
Purchase History
| Date | Buyer | Sale Price | Title Company |
|---|---|---|---|
| Brennan Ft | -- | None Available | |
| Brennan Russell L | -- | -- |
Source: Public Records
Mortgage History
| Date | Status | Borrower | Loan Amount |
|---|---|---|---|
| Previous Owner | Brennan Russell L | $15,000 | |
| Previous Owner | Brennan Russell L | $38,000 | |
| Previous Owner | Brennan Russell L | $20,000 | |
| Previous Owner | Brennan Russell L | $15,000 |
Source: Public Records
Tax History Compared to Growth
Tax History
| Year | Tax Paid | Tax Assessment Tax Assessment Total Assessment is a certain percentage of the fair market value that is determined by local assessors to be the total taxable value of land and additions on the property. | Land | Improvement |
|---|---|---|---|---|
| 2025 | $4,936 | $399,700 | $142,500 | $257,200 |
| 2024 | $4,705 | $381,000 | $142,500 | $238,500 |
| 2023 | $4,561 | $347,900 | $127,300 | $220,600 |
| 2022 | $4,150 | $311,100 | $122,100 | $189,000 |
| 2021 | $3,984 | $293,600 | $108,100 | $185,500 |
| 2020 | $3,739 | $283,900 | $108,000 | $175,900 |
| 2019 | $3,460 | $264,900 | $101,500 | $163,400 |
| 2018 | $3,121 | $233,800 | $98,700 | $135,100 |
| 2017 | $2,660 | $197,600 | $96,300 | $101,300 |
| 2016 | $2,640 | $196,900 | $96,300 | $100,600 |
| 2015 | $2,577 | $194,800 | $96,300 | $98,500 |
Source: Public Records
Map
Nearby Homes