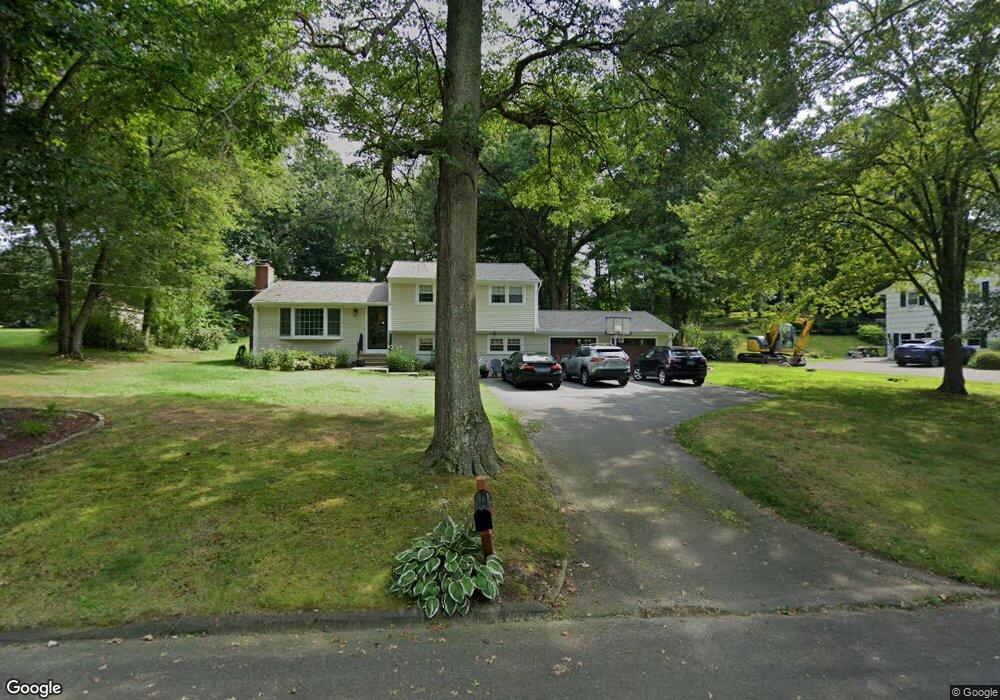
20 Woodside Rd Guilford, CT 06437
Estimated Value: $444,000 - $570,000
3
Beds
2
Baths
1,056
Sq Ft
$464/Sq Ft
Est. Value
About This Home
This home is located at 20 Woodside Rd, Guilford, CT 06437 and is currently estimated at $489,547, approximately $463 per square foot. 20 Woodside Rd is a home located in New Haven County with nearby schools including A. Baldwin Middle School, E.C. Adams Middle School, and Guilford High School.
Ownership History
Date
Name
Owned For
Owner Type
Purchase Details
Closed on
May 1, 1998
Sold by
Walsh Cornelia A
Bought by
Nerney Joseph M and Nerney Simona
Current Estimated Value
Home Financials for this Owner
Home Financials are based on the most recent Mortgage that was taken out on this home.
Original Mortgage
$143,150
Interest Rate
7.04%
Mortgage Type
Unknown
Create a Home Valuation Report for This Property
The Home Valuation Report is an in-depth analysis detailing your home's value as well as a comparison with similar homes in the area
Home Values in the Area
Average Home Value in this Area
Purchase History
| Date | Buyer | Sale Price | Title Company |
|---|---|---|---|
| Nerney Joseph M | $152,000 | -- |
Source: Public Records
Mortgage History
| Date | Status | Borrower | Loan Amount |
|---|---|---|---|
| Open | Nerney Joseph M | $224,000 | |
| Closed | Nerney Joseph M | $143,150 | |
| Previous Owner | Nerney Joseph M | $44,000 |
Source: Public Records
Tax History
| Year | Tax Paid | Tax Assessment Tax Assessment Total Assessment is a certain percentage of the fair market value that is determined by local assessors to be the total taxable value of land and additions on the property. | Land | Improvement |
|---|---|---|---|---|
| 2025 | $6,047 | $218,680 | $117,600 | $101,080 |
| 2024 | $5,813 | $218,680 | $117,600 | $101,080 |
| 2023 | $5,659 | $218,680 | $117,600 | $101,080 |
| 2022 | $5,848 | $175,870 | $117,600 | $58,270 |
| 2021 | $5,737 | $175,870 | $117,600 | $58,270 |
| 2020 | $5,682 | $175,870 | $117,600 | $58,270 |
| 2019 | $5,633 | $175,870 | $117,600 | $58,270 |
| 2018 | $5,456 | $174,410 | $117,600 | $56,810 |
| 2017 | $5,399 | $183,900 | $120,960 | $62,940 |
| 2016 | $5,272 | $183,900 | $120,960 | $62,940 |
| 2015 | $5,193 | $183,900 | $120,960 | $62,940 |
| 2014 | $5,043 | $183,900 | $120,960 | $62,940 |
Source: Public Records
Map
Nearby Homes
- 20 Long Hill Farm
- 83 Long Hill Farm Unit 83
- 77 Pinebrook Cir
- 13 Dunham Dr Unit 13
- 4 Copper Ridge Cir
- 16 Copper Hill Dr
- LOT #22 Kenneth Cir Unit MAP 77
- 876 Nut Plains Rd
- 874 Nut Plains Rd Unit Lot 2 - Style A
- LOT 28B Bruce Ln Unit MAP 83
- 296 Valley Shore Dr
- 0 Long Hill Rd Unit 24156467
- 258 Nut Plains Rd
- 2064 Long Hill Rd
- 87 White Birch Dr
- 2125 Long Hill Rd
- 25 Sullivan Dr
- 24 Echo Point Rd
- 0 Tamarack Ln Unit Lot 19 24071360
- 294 Church St
- 36 Orchard View Rd
- 32 Woodside Rd
- 630 New England Rd
- 616 New England Rd
- 44 Woodside Rd
- 640 New England Rd
- 21 Woodside Rd
- 62 Orchard View Rd
- 37 Orchard View Rd
- 602 New England Rd
- 23 Orchard View Rd
- 53 Orchard View Rd
- 45 Woodside Rd
- 60 Woodside Rd
- 664 New England Rd
- 590 New England Rd
- 65 Orchard View Rd
- 61 Woodside Rd
- 80 Orchard View Rd
- 682 New England Rd
Your Personal Tour Guide
Ask me questions while you tour the home.