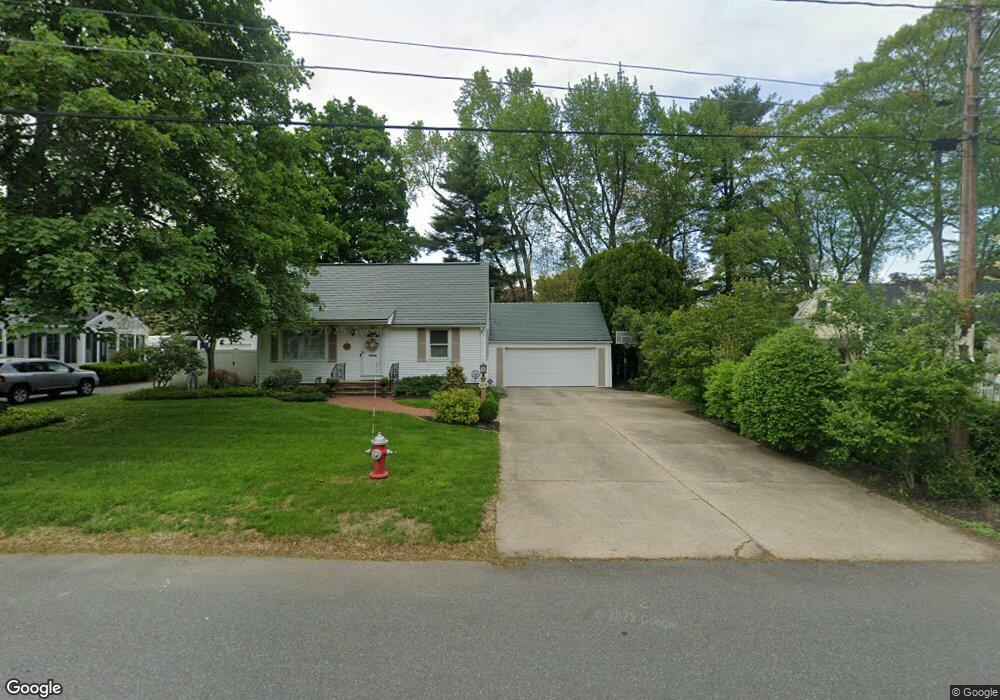
20 Woodward Rd West Springfield, MA 01089
Estimated Value: $372,000 - $427,000
3
Beds
2
Baths
2,060
Sq Ft
$190/Sq Ft
Est. Value
About This Home
This home is located at 20 Woodward Rd, West Springfield, MA 01089 and is currently estimated at $392,294, approximately $190 per square foot. 20 Woodward Rd is a home located in Hampden County with nearby schools including St Thomas The Apostle School.
Ownership History
Date
Name
Owned For
Owner Type
Purchase Details
Closed on
Aug 26, 2011
Sold by
House Margaret H Est and House Robert A
Bought by
Cardaropoli Laura J
Current Estimated Value
Home Financials for this Owner
Home Financials are based on the most recent Mortgage that was taken out on this home.
Original Mortgage
$180,000
Outstanding Balance
$124,841
Interest Rate
4.53%
Mortgage Type
Purchase Money Mortgage
Estimated Equity
$267,453
Create a Home Valuation Report for This Property
The Home Valuation Report is an in-depth analysis detailing your home's value as well as a comparison with similar homes in the area
Home Values in the Area
Average Home Value in this Area
Purchase History
| Date | Buyer | Sale Price | Title Company |
|---|---|---|---|
| Cardaropoli Laura J | $200,000 | -- |
Source: Public Records
Mortgage History
| Date | Status | Borrower | Loan Amount |
|---|---|---|---|
| Open | Cardaropoli Laura J | $180,000 |
Source: Public Records
Tax History Compared to Growth
Tax History
| Year | Tax Paid | Tax Assessment Tax Assessment Total Assessment is a certain percentage of the fair market value that is determined by local assessors to be the total taxable value of land and additions on the property. | Land | Improvement |
|---|---|---|---|---|
| 2025 | $4,669 | $314,000 | $124,400 | $189,600 |
| 2024 | $4,646 | $313,700 | $124,400 | $189,300 |
| 2023 | $4,329 | $278,600 | $124,400 | $154,200 |
| 2022 | $4,276 | $271,300 | $112,900 | $158,400 |
| 2021 | $4,127 | $244,200 | $104,700 | $139,500 |
| 2020 | $3,578 | $210,600 | $104,700 | $105,900 |
| 2019 | $3,572 | $210,600 | $104,700 | $105,900 |
| 2018 | $3,591 | $210,600 | $104,700 | $105,900 |
| 2017 | $3,591 | $210,600 | $104,700 | $105,900 |
| 2016 | $3,544 | $208,600 | $100,600 | $108,000 |
| 2015 | $3,476 | $204,600 | $98,700 | $105,900 |
| 2014 | $844 | $204,600 | $98,700 | $105,900 |
Source: Public Records
Map
Nearby Homes
- 258 Poplar Ave
- 148 Craiwell Ave
- 416 Hillcrest Ave
- 180 Wolcott Ave
- 32 Lotus Ave
- 139 Upper Beverly Hills
- 260 Wolcott Ave
- 7 Brewster Rd
- 16 North St
- 65 Verdugo St
- 8 Ridgeview Dr
- 42 Janet St
- lot A North St
- 19 Cora St
- 56 Taft St
- 36 Maple Terrace
- 74 Maple Terrace
- 50 Howard St
- 61 Clarence St
- 468 Springfield St