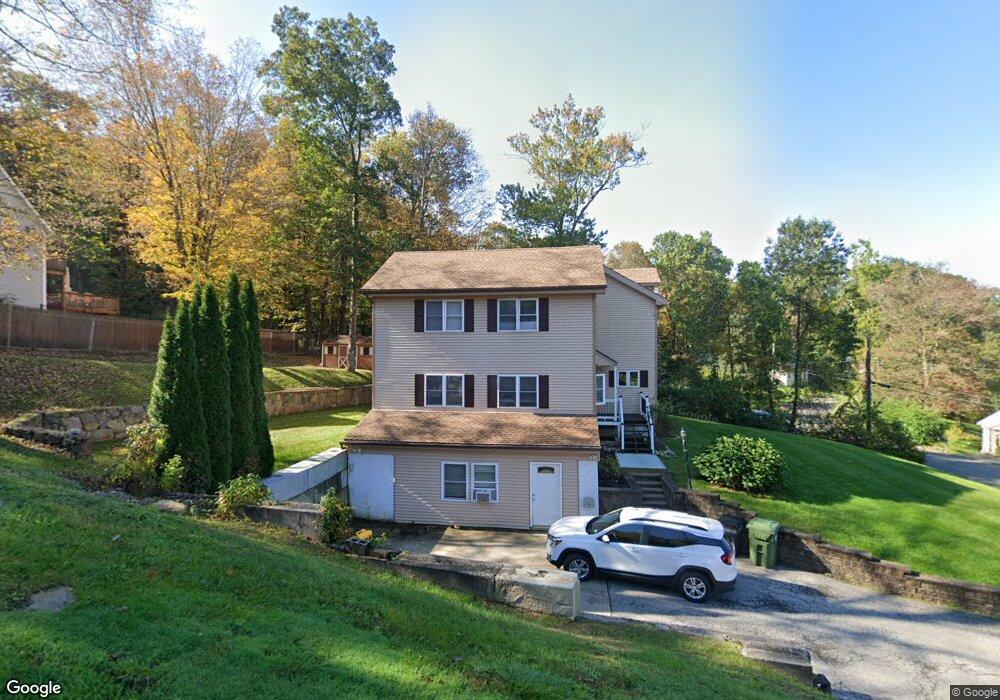
20 Yale Dr New Fairfield, CT 06812
Estimated Value: $555,000 - $597,000
3
Beds
3
Baths
2,228
Sq Ft
$256/Sq Ft
Est. Value
About This Home
This home is located at 20 Yale Dr, New Fairfield, CT 06812 and is currently estimated at $570,606, approximately $256 per square foot. 20 Yale Dr is a home located in Fairfield County with nearby schools including Meeting House Hill School, New Fairfield Middle School, and New Fairfield High School.
Ownership History
Date
Name
Owned For
Owner Type
Purchase Details
Closed on
Aug 15, 2025
Sold by
Winch Karen D and Winch John K
Bought by
Green Stephen and Winch-Green Jordan
Current Estimated Value
Home Financials for this Owner
Home Financials are based on the most recent Mortgage that was taken out on this home.
Original Mortgage
$150,000
Outstanding Balance
$149,608
Interest Rate
6.72%
Mortgage Type
Future Advance Clause Open End Mortgage
Estimated Equity
$420,998
Purchase Details
Closed on
May 11, 2022
Sold by
Winch Karen D
Bought by
Winch Karen D and Winch John K
Create a Home Valuation Report for This Property
The Home Valuation Report is an in-depth analysis detailing your home's value as well as a comparison with similar homes in the area
Home Values in the Area
Average Home Value in this Area
Purchase History
| Date | Buyer | Sale Price | Title Company |
|---|---|---|---|
| Green Stephen | $550,000 | -- | |
| Winch Karen D | -- | None Available | |
| Winch Karen D | -- | None Available |
Source: Public Records
Mortgage History
| Date | Status | Borrower | Loan Amount |
|---|---|---|---|
| Open | Green Stephen | $150,000 |
Source: Public Records
Tax History Compared to Growth
Tax History
| Year | Tax Paid | Tax Assessment Tax Assessment Total Assessment is a certain percentage of the fair market value that is determined by local assessors to be the total taxable value of land and additions on the property. | Land | Improvement |
|---|---|---|---|---|
| 2025 | $9,413 | $357,500 | $86,500 | $271,000 |
| 2024 | $8,381 | $229,500 | $80,600 | $148,900 |
| 2023 | $8,010 | $229,500 | $80,600 | $148,900 |
| 2022 | $7,452 | $229,500 | $80,600 | $148,900 |
| 2021 | $7,227 | $229,500 | $80,600 | $148,900 |
| 2020 | $7,018 | $229,500 | $80,600 | $148,900 |
| 2019 | $6,152 | $199,100 | $65,800 | $133,300 |
| 2018 | $6,088 | $199,100 | $65,800 | $133,300 |
| 2017 | $5,937 | $199,100 | $65,800 | $133,300 |
| 2016 | $5,710 | $199,100 | $65,800 | $133,300 |
| 2015 | $5,710 | $199,100 | $65,800 | $133,300 |
| 2014 | $5,725 | $219,500 | $73,100 | $146,400 |
Source: Public Records
Map
Nearby Homes