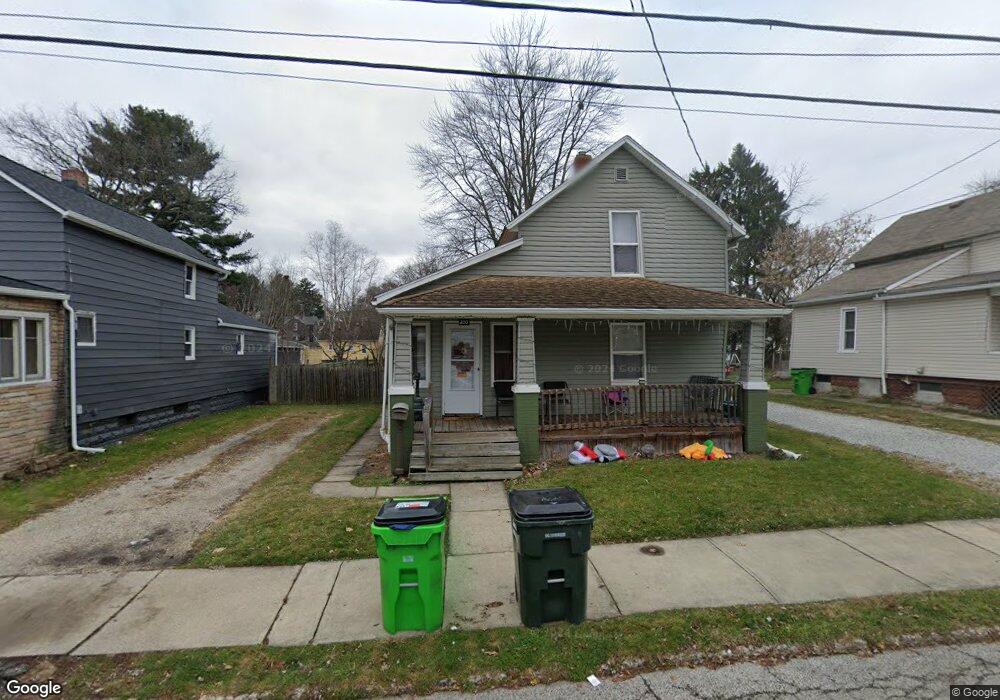
200 17th St NW Barberton, OH 44203
Columbia Lake NeighborhoodEstimated Value: $119,000 - $149,468
3
Beds
2
Baths
1,530
Sq Ft
$89/Sq Ft
Est. Value
About This Home
This home is located at 200 17th St NW, Barberton, OH 44203 and is currently estimated at $136,117, approximately $88 per square foot. 200 17th St NW is a home located in Summit County with nearby schools including Barberton Middle School, Barberton High School, and St Augustine Elementary School.
Ownership History
Date
Name
Owned For
Owner Type
Purchase Details
Closed on
Jul 13, 2017
Sold by
Bittinger Alan C
Bought by
Magic City Properties Llc
Current Estimated Value
Purchase Details
Closed on
Nov 3, 2016
Sold by
Federal Home Loan Mortgage Corporation
Bought by
Bittinger Alan C
Purchase Details
Closed on
Jun 28, 2016
Sold by
Forshee David M
Bought by
The Federal Home Loan Coropration
Purchase Details
Closed on
May 2, 2007
Sold by
James William R
Bought by
Forshee David M and Forshee Denise L
Home Financials for this Owner
Home Financials are based on the most recent Mortgage that was taken out on this home.
Original Mortgage
$33,750
Interest Rate
6.27%
Mortgage Type
Purchase Money Mortgage
Purchase Details
Closed on
Feb 26, 2007
Sold by
Estate Of Yuteva L James
Bought by
James William G
Create a Home Valuation Report for This Property
The Home Valuation Report is an in-depth analysis detailing your home's value as well as a comparison with similar homes in the area
Home Values in the Area
Average Home Value in this Area
Purchase History
| Date | Buyer | Sale Price | Title Company |
|---|---|---|---|
| Magic City Properties Llc | -- | None Available | |
| Bittinger Alan C | -- | None Available | |
| The Federal Home Loan Coropration | $36,000 | None Available | |
| Forshee David M | $45,000 | Lawyers Title Ins | |
| James William G | -- | None Available |
Source: Public Records
Mortgage History
| Date | Status | Borrower | Loan Amount |
|---|---|---|---|
| Previous Owner | Forshee David M | $33,750 |
Source: Public Records
Tax History Compared to Growth
Tax History
| Year | Tax Paid | Tax Assessment Tax Assessment Total Assessment is a certain percentage of the fair market value that is determined by local assessors to be the total taxable value of land and additions on the property. | Land | Improvement |
|---|---|---|---|---|
| 2025 | $1,962 | $38,220 | $9,009 | $29,211 |
| 2024 | $1,962 | $38,220 | $9,009 | $29,211 |
| 2023 | $1,962 | $38,220 | $9,009 | $29,211 |
| 2022 | $1,380 | $23,307 | $5,460 | $17,847 |
| 2021 | $1,378 | $23,307 | $5,460 | $17,847 |
| 2020 | $1,349 | $23,310 | $5,460 | $17,850 |
| 2019 | $1,219 | $19,080 | $5,460 | $13,620 |
| 2018 | $1,201 | $19,080 | $5,460 | $13,620 |
| 2017 | $1,685 | $19,080 | $5,460 | $13,620 |
| 2016 | $1,220 | $19,080 | $5,460 | $13,620 |
| 2015 | $1,685 | $19,080 | $5,460 | $13,620 |
| 2014 | $1,211 | $19,080 | $5,460 | $13,620 |
| 2013 | $1,342 | $21,920 | $5,460 | $16,460 |
Source: Public Records
Map
Nearby Homes
- 243 19th St NW
- 376 Hillsdale Ave
- 236 14th St NW
- 1080 Belleview Ave
- 139 24th St NW
- 243 27th St NW
- 38 24th St NW
- 96 Helen St
- 679 Wooster Rd W
- 524 Long Dr
- 673 Wooster Rd W
- 3193 Trotter Rd
- 108 30th St NW
- 610 Creedmore Ave
- 564 W Hopocan Ave
- 583 Creedmore Ave
- 2676 Pinegate Dr
- 1274 Auburn Ave
- 21 29th St SW
- 1099 Prospect St
- 196 17th St NW
- 204 17th St NW
- 210 17th St NW
- 184 17th St NW
- 971 Shannon Ave
- 211 19th St NW
- 207 19th St NW
- 217 19th St NW
- 214 17th St NW
- 221 19th St NW
- 199 17th St NW
- 203 17th St NW
- 195 17th St NW
- 207 17th St NW
- 227 19th St NW
- 220 17th St NW
- 195 19th St NW
- 189 17th St NW
- 211 17th St NW
- 231 19th St NW