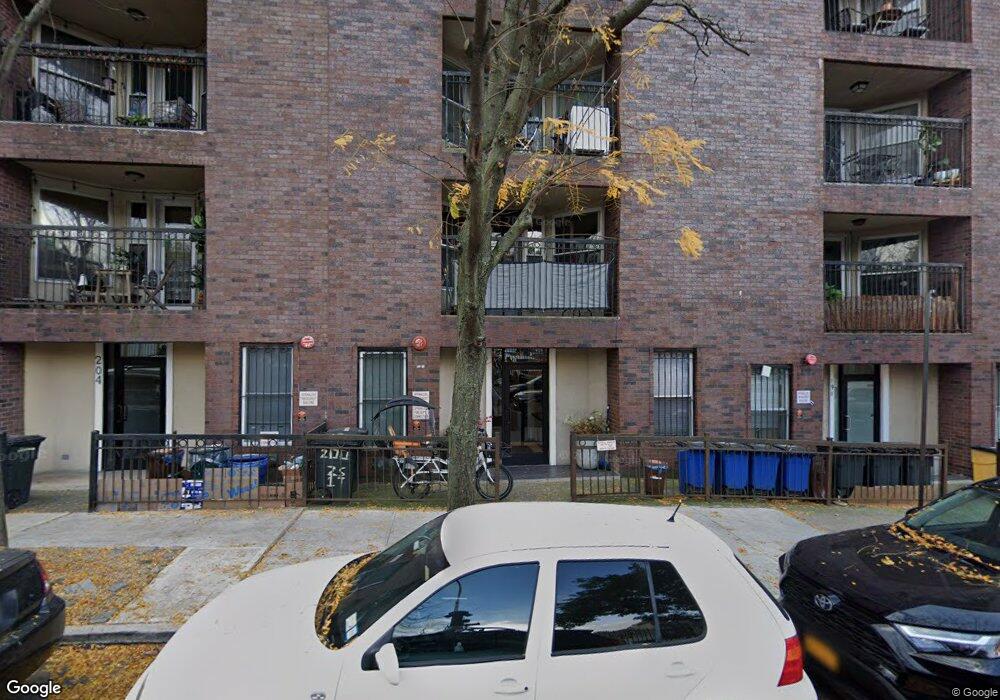
200 21st St Unit 1B Brooklyn, NY 11232
South Slope NeighborhoodEstimated Value: $885,000 - $1,272,000
Studio
--
Bath
1,069
Sq Ft
$989/Sq Ft
Est. Value
About This Home
This home is located at 200 21st St Unit 1B, Brooklyn, NY 11232 and is currently estimated at $1,057,763, approximately $989 per square foot. 200 21st St Unit 1B is a home located in Kings County with nearby schools including P.S. 295 - The Studio School of Arts & Culture, Hellenic Classical Charter School - Park Slope, and Al-Noor School.
Ownership History
Date
Name
Owned For
Owner Type
Purchase Details
Closed on
Nov 15, 2012
Sold by
Demetriades Elizabeth and Demetriades Walter Peter
Bought by
Ng Elizabeth and Ng Yat Andy
Current Estimated Value
Home Financials for this Owner
Home Financials are based on the most recent Mortgage that was taken out on this home.
Original Mortgage
$417,000
Outstanding Balance
$285,949
Interest Rate
3.38%
Mortgage Type
New Conventional
Estimated Equity
$771,814
Purchase Details
Closed on
Oct 23, 2006
Sold by
200 21St Street Llc and Abraham Sandberg %
Bought by
Demetriades Elizabeth and Demetriades Walter Peter
Home Financials for this Owner
Home Financials are based on the most recent Mortgage that was taken out on this home.
Original Mortgage
$79,800
Interest Rate
6.47%
Create a Home Valuation Report for This Property
The Home Valuation Report is an in-depth analysis detailing your home's value as well as a comparison with similar homes in the area
Home Values in the Area
Average Home Value in this Area
Purchase History
| Date | Buyer | Sale Price | Title Company |
|---|---|---|---|
| Ng Elizabeth | $560,000 | -- | |
| Ng Elizabeth | $560,000 | -- | |
| Demetriades Elizabeth | $404,586 | -- | |
| Demetriades Elizabeth | $404,586 | -- |
Source: Public Records
Mortgage History
| Date | Status | Borrower | Loan Amount |
|---|---|---|---|
| Open | Ng Elizabeth | $417,000 | |
| Closed | Ng Elizabeth | $417,000 | |
| Previous Owner | Demetriades Elizabeth | $79,800 | |
| Previous Owner | Demetriades Elizabeth | $319,200 |
Source: Public Records
Tax History
| Year | Tax Paid | Tax Assessment Tax Assessment Total Assessment is a certain percentage of the fair market value that is determined by local assessors to be the total taxable value of land and additions on the property. | Land | Improvement |
|---|---|---|---|---|
| 2025 | $179 | $144,796 | $6,004 | $138,792 |
| 2024 | $179 | $129,750 | $6,004 | $123,746 |
| 2023 | $176 | $125,264 | $6,004 | $119,260 |
| 2022 | $175 | $123,125 | $6,004 | $117,121 |
| 2021 | $176 | $111,185 | $6,004 | $105,181 |
| 2020 | $86 | $121,537 | $6,004 | $115,533 |
| 2019 | $181 | $116,085 | $6,004 | $110,081 |
| 2018 | $182 | $93,451 | $4,167 | $89,284 |
| 2017 | $182 | $86,530 | $4,484 | $82,046 |
| 2016 | $185 | $80,121 | $4,936 | $75,185 |
| 2015 | $144 | $80,121 | $5,922 | $74,199 |
| 2014 | $144 | $77,636 | $5,889 | $71,747 |
Source: Public Records
Map
Nearby Homes
- 193 22nd St Unit 1
- 193 22nd St Unit 2
- 193 23rd St Unit A
- 211 23rd St Unit 8
- 684 4th Ave
- 179 20th St Unit 9B
- 179 20th St Unit 3-B
- 179 20th St Unit 2A
- 179 20th St Unit 3-C
- 179 20th St Unit 10-B
- 179 20th St Unit 8B
- 179 20th St Unit 4-A
- 179 20th St Unit 4-B
- 179 20th St Unit 6-A
- 179 20th St Unit 7-C
- 179 20th St Unit 8A
- 179 20th St Unit 5-C
- 216 20th St Unit 2
- 216 20th St Unit 1B
- 2 5th Ave Unit 15-U
- 200 21st St Unit 4B
- 200 21st St Unit 4A
- 200 21st St Unit 3B
- 200 21st St Unit 3A
- 200 21st St Unit 2B
- 200 21st St Unit 2A
- 200 21st St Unit 1A
- 200 21st St
- 204 21st St Unit 4B
- 204 21st St Unit 4A
- 204 21st St Unit 3B
- 204 21st St Unit 3A
- 204 21st St Unit 2B
- 204 21st St Unit 2A
- 204 21st St Unit 1B
- 204 21st St Unit 1A
- 204 21st St
- 198 21st St Unit 4B
- 198 21st St Unit 4A
- 198 21st St Unit 3B
Your Personal Tour Guide
Ask me questions while you tour the home.