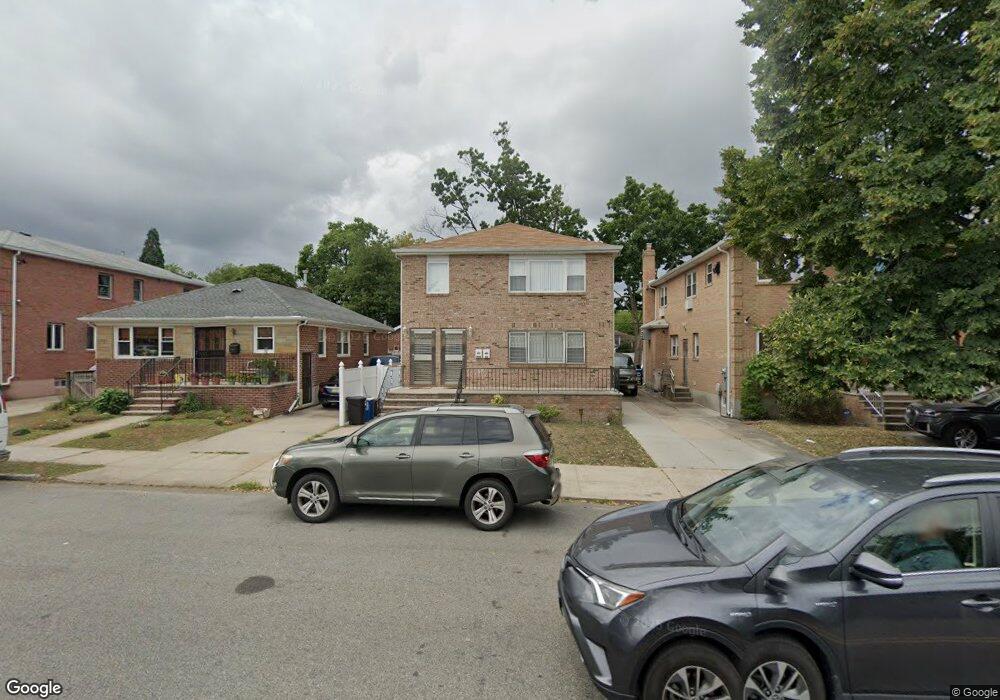
200-23 46th Ave Unit 2F Bayside, NY 11361
Auburndale NeighborhoodEstimated Value: $1,526,918 - $1,971,000
3
Beds
2
Baths
1,170
Sq Ft
$1,498/Sq Ft
Est. Value
About This Home
This home is located at 200-23 46th Ave Unit 2F, Bayside, NY 11361 and is currently estimated at $1,752,980, approximately $1,498 per square foot. 200-23 46th Ave Unit 2F is a home located in Queens County with nearby schools including P.S. 162 The John Golden School, M.S. 158 - Marie Curie, and Francis Lewis High School.
Ownership History
Date
Name
Owned For
Owner Type
Purchase Details
Closed on
Jan 6, 2010
Sold by
Salvatore Romano
Bought by
Huang Zi Ming and Zhang Ru
Current Estimated Value
Home Financials for this Owner
Home Financials are based on the most recent Mortgage that was taken out on this home.
Original Mortgage
$330,000
Outstanding Balance
$213,151
Interest Rate
4.79%
Mortgage Type
Purchase Money Mortgage
Estimated Equity
$1,539,829
Purchase Details
Closed on
Jan 17, 2002
Sold by
Gr Development Corp
Bought by
Romano Salvatore
Home Financials for this Owner
Home Financials are based on the most recent Mortgage that was taken out on this home.
Original Mortgage
$233,750
Interest Rate
7.01%
Purchase Details
Closed on
Aug 10, 1995
Sold by
Kaiser Marie A and Kaiser Margaret L
Bought by
Kaiser Marie A and Kaiser Anna R
Create a Home Valuation Report for This Property
The Home Valuation Report is an in-depth analysis detailing your home's value as well as a comparison with similar homes in the area
Home Values in the Area
Average Home Value in this Area
Purchase History
| Date | Buyer | Sale Price | Title Company |
|---|---|---|---|
| Huang Zi Ming | $997,000 | -- | |
| Huang Zi Ming | $997,000 | -- | |
| Romano Salvatore | -- | -- | |
| Gr Development Corp | -- | -- | |
| Romano Salvatore | -- | -- | |
| Kaiser Marie A | -- | First American Title Ins Co | |
| Kaiser Marie A | -- | First American Title Ins Co |
Source: Public Records
Mortgage History
| Date | Status | Borrower | Loan Amount |
|---|---|---|---|
| Open | Huang Zi Ming | $330,000 | |
| Closed | Huang Zi Ming | $330,000 | |
| Previous Owner | Romano Salvatore | $233,750 |
Source: Public Records
Tax History
| Year | Tax Paid | Tax Assessment Tax Assessment Total Assessment is a certain percentage of the fair market value that is determined by local assessors to be the total taxable value of land and additions on the property. | Land | Improvement |
|---|---|---|---|---|
| 2025 | $13,864 | $69,029 | $11,687 | $57,342 |
| 2024 | $13,864 | $69,029 | $12,284 | $56,745 |
| 2023 | $13,154 | $65,494 | $11,375 | $54,119 |
| 2022 | $12,352 | $86,820 | $17,340 | $69,480 |
| 2021 | $12,550 | $71,940 | $17,340 | $54,600 |
| 2020 | $12,176 | $79,080 | $17,340 | $61,740 |
| 2019 | $12,033 | $72,600 | $17,340 | $55,260 |
| 2018 | $11,126 | $54,578 | $11,438 | $43,140 |
| 2017 | $10,511 | $51,562 | $13,461 | $38,101 |
| 2016 | $9,935 | $51,562 | $13,461 | $38,101 |
| 2015 | $5,867 | $47,937 | $16,012 | $31,925 |
| 2014 | $5,867 | $47,937 | $16,181 | $31,756 |
Source: Public Records
Map
Nearby Homes
- 200-38 45th Ave
- 47-02 Francis Lewis Blvd
- 199-04 47th Ave
- 196-64 45th Ave
- 46-38 204th St
- 45-66 196th Place
- 204-19 46th Rd
- 20206 Rocky Hill Rd Unit C1
- 42-36 201st St
- 45-31 195th St
- 48-18 202nd St
- 43-28 196th St
- 46-27 206th St
- 206-16 45th Rd
- 4604 195th St
- 43-44 195th St
- 4734 206th St
- 4215 204th St
- 206-50 46th Ave
- 196-19 42nd Rd
- 200-23 46th Ave Unit 2
- 200-23 46th Ave
- 20023 46th Ave Unit 2F
- 20023 46th Ave Unit 2Fl
- 20023 46th Ave
- 20027 46th Ave
- 20019 46th Ave
- 20031 46th Ave Unit 1 Fl
- 20031 46th Ave
- 20015 46th Ave
- 20031 46th Ave
- 20030 45th Dr
- 20034 45th Dr
- 20011 46th Ave
- 20026 45th Dr
- 20038 45th Dr Unit 1st fl
- 20022 45th Dr
- 4566 202nd St
- 4570 202nd St
- 200-22 45th Dr
Your Personal Tour Guide
Ask me questions while you tour the home.