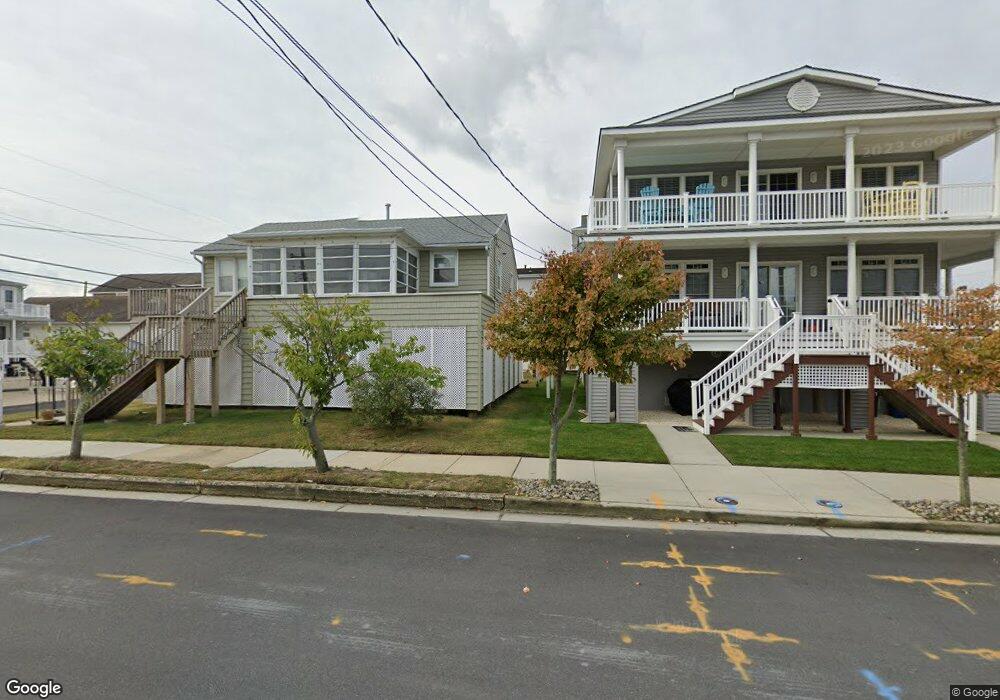
200 31st St Unit 2 Ocean City, NJ 08226
Estimated Value: $1,183,000 - $1,249,000
--
Bed
--
Bath
1,684
Sq Ft
$725/Sq Ft
Est. Value
About This Home
This home is located at 200 31st St Unit 2, Ocean City, NJ 08226 and is currently estimated at $1,220,312, approximately $724 per square foot. 200 31st St Unit 2 is a home located in Cape May County with nearby schools including Ocean City Primary School, Ocean City Intermediate School, and Ocean City High School.
Ownership History
Date
Name
Owned For
Owner Type
Purchase Details
Closed on
Dec 29, 2020
Sold by
Milam Matthew W and Milam Karen M
Bought by
Gunn Norman J and Gunn Patricia E
Current Estimated Value
Home Financials for this Owner
Home Financials are based on the most recent Mortgage that was taken out on this home.
Original Mortgage
$475,000
Outstanding Balance
$423,939
Interest Rate
2.71%
Mortgage Type
New Conventional
Estimated Equity
$796,373
Purchase Details
Closed on
Dec 16, 2016
Sold by
Ochs Matthew E and Ochs Judith J
Bought by
Milam Matthew W and Milam Karen M
Purchase Details
Closed on
May 26, 2005
Sold by
Chase Andrew B and Stone Bernard J
Bought by
Ochs Matthew E and Ochs Judith E
Home Financials for this Owner
Home Financials are based on the most recent Mortgage that was taken out on this home.
Original Mortgage
$591,200
Interest Rate
5.25%
Mortgage Type
Fannie Mae Freddie Mac
Create a Home Valuation Report for This Property
The Home Valuation Report is an in-depth analysis detailing your home's value as well as a comparison with similar homes in the area
Home Values in the Area
Average Home Value in this Area
Purchase History
| Date | Buyer | Sale Price | Title Company |
|---|---|---|---|
| Gunn Norman J | $710,000 | Shore Title | |
| Milam Matthew W | $610,000 | Freedom Title & Abstract Co | |
| Ochs Matthew E | $739,000 | The Title Company Of Jersey |
Source: Public Records
Mortgage History
| Date | Status | Borrower | Loan Amount |
|---|---|---|---|
| Open | Gunn Norman J | $475,000 | |
| Previous Owner | Ochs Matthew E | $591,200 |
Source: Public Records
Tax History Compared to Growth
Tax History
| Year | Tax Paid | Tax Assessment Tax Assessment Total Assessment is a certain percentage of the fair market value that is determined by local assessors to be the total taxable value of land and additions on the property. | Land | Improvement |
|---|---|---|---|---|
| 2025 | $7,176 | $639,600 | $283,400 | $356,200 |
| 2024 | $7,176 | $639,600 | $283,400 | $356,200 |
| 2023 | $6,687 | $624,400 | $283,400 | $341,000 |
| 2022 | $6,425 | $624,400 | $283,400 | $341,000 |
| 2021 | $6,275 | $624,400 | $283,400 | $341,000 |
| 2020 | $6,107 | $624,400 | $283,400 | $341,000 |
| 2019 | $6,038 | $624,400 | $283,400 | $341,000 |
| 2018 | $5,982 | $624,400 | $283,400 | $341,000 |
| 2017 | $5,888 | $624,400 | $283,400 | $341,000 |
| 2016 | $5,663 | $624,400 | $283,400 | $341,000 |
| 2015 | $5,570 | $622,300 | $318,800 | $303,500 |
| 2014 | $5,489 | $622,300 | $318,800 | $303,500 |
Source: Public Records
Map
Nearby Homes
- 3037 Haven Ave Unit 3039
- 3039 Haven Ave Unit 2
- 3108 Bay Ave
- 3122 Asbury Ave Unit 2nd
- 3109 Central Ave Unit 1
- 3113 Central Ave Unit 3N
- 3135 Central Ave Unit 2
- 3108 Wesley Ave Unit 1S
- 13 Waterway Rd
- 2904 Haven Ave
- 15 Waterway Rd
- 3311 Simpson Ave Unit 2
- 3316 Asbury Ave Unit 1
- 3314 West Ave Unit 2
- 3329 Haven Ave Unit 1
- 3332 Simpson Ave
- 3338 Asbury Ave Unit 1
- 3338-40 Asbury Ave
- 3340 Asbury Ave Unit 2
- 3313 Bay Ave
- 200 31st St Unit C-1
- 200 31st St Unit 2
- 206 31st St Unit 2nd Floor
- 204 31st St
- 204 31st St Unit 1st Floor
- 3109 Haven Ave Unit 11
- 3109 Haven Ave Unit 11
- 3115 Haven Ave Unit 2nd Floor
- 3113 Haven Ave Unit 15
- 3113 Haven Ave Unit 15
- 3113 Haven Ave Unit 15
- 207 31st St Unit two
- 207 31st St Unit 2
- 209 31st St Unit 2
- 209 31st St Unit 2nd Floor
- 209 31st St
- 209 31st St Unit B
- 203 31st St
- 205 31st St Unit 7
- 205 31st St Unit 7