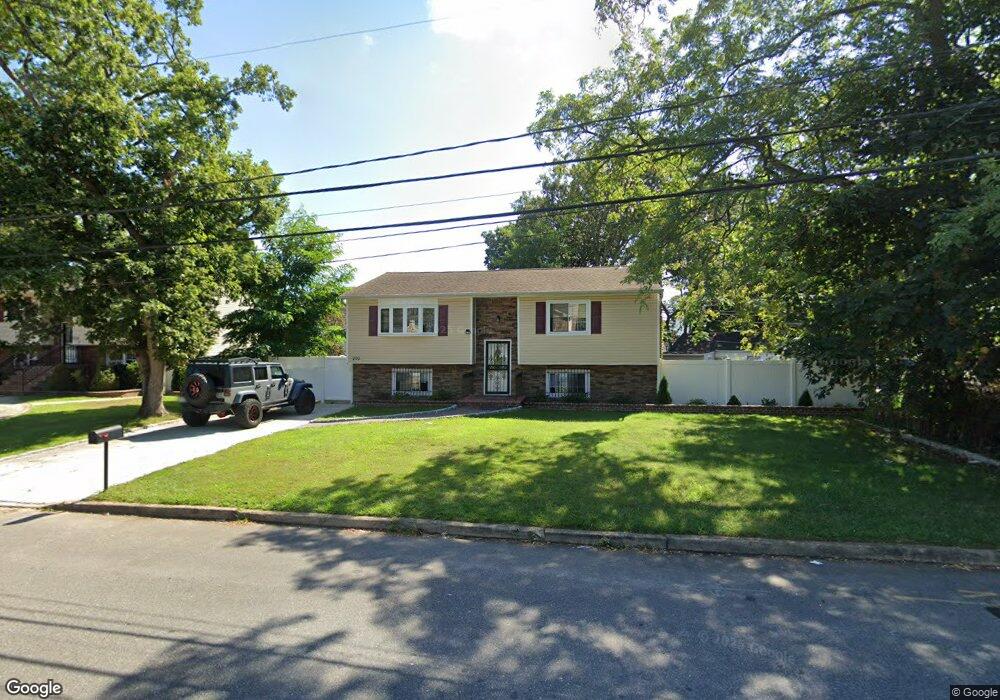
200 41st St Copiague, NY 11726
Estimated Value: $618,000 - $711,000
5
Beds
2
Baths
2,016
Sq Ft
$326/Sq Ft
Est. Value
About This Home
This home is located at 200 41st St, Copiague, NY 11726 and is currently estimated at $657,634, approximately $326 per square foot. 200 41st St is a home located in Suffolk County with nearby schools including Copiague Middle School, Walter G O Connell Copiague High School, and Copiague Christian Academy.
Ownership History
Date
Name
Owned For
Owner Type
Purchase Details
Closed on
Nov 21, 2013
Sold by
Carroll Esq Diane C and Juman Merlyn
Bought by
Samson Immacula and Nazaire Anthony J
Current Estimated Value
Purchase Details
Closed on
Feb 21, 2007
Purchase Details
Closed on
Aug 29, 2005
Purchase Details
Closed on
Apr 30, 2004
Sold by
Pessoa Marlene and Hendricks Karlene
Bought by
Francis Angela
Home Financials for this Owner
Home Financials are based on the most recent Mortgage that was taken out on this home.
Original Mortgage
$286,200
Interest Rate
6.75%
Mortgage Type
Purchase Money Mortgage
Purchase Details
Closed on
Jun 12, 2002
Sold by
Armstrong Alysshia M
Bought by
Pessoa Marlene and Hendricks Karlene
Home Financials for this Owner
Home Financials are based on the most recent Mortgage that was taken out on this home.
Original Mortgage
$231,200
Interest Rate
6.92%
Create a Home Valuation Report for This Property
The Home Valuation Report is an in-depth analysis detailing your home's value as well as a comparison with similar homes in the area
Home Values in the Area
Average Home Value in this Area
Purchase History
| Date | Buyer | Sale Price | Title Company |
|---|---|---|---|
| Samson Immacula | $122,890 | -- | |
| -- | $333,900 | -- | |
| -- | -- | -- | |
| Francis Angela | $319,000 | -- | |
| Pessoa Marlene | $235,000 | Chicago Title |
Source: Public Records
Mortgage History
| Date | Status | Borrower | Loan Amount |
|---|---|---|---|
| Previous Owner | Francis Angela | $286,200 | |
| Previous Owner | Pessoa Marlene | $231,200 | |
| Closed | Samson Immacula | $0 |
Source: Public Records
Tax History
| Year | Tax Paid | Tax Assessment Tax Assessment Total Assessment is a certain percentage of the fair market value that is determined by local assessors to be the total taxable value of land and additions on the property. | Land | Improvement |
|---|---|---|---|---|
| 2024 | $11,144 | $3,150 | $210 | $2,940 |
| 2023 | $11,144 | $3,150 | $210 | $2,940 |
| 2022 | $10,142 | $3,150 | $210 | $2,940 |
| 2021 | $10,142 | $3,150 | $210 | $2,940 |
| 2020 | $10,596 | $3,150 | $210 | $2,940 |
| 2019 | $10,596 | $0 | $0 | $0 |
| 2018 | $10,176 | $3,150 | $210 | $2,940 |
| 2017 | $10,176 | $3,150 | $210 | $2,940 |
| 2016 | $10,094 | $3,150 | $210 | $2,940 |
| 2015 | -- | $3,150 | $210 | $2,940 |
| 2014 | -- | $3,150 | $210 | $2,940 |
Source: Public Records
Map
Nearby Homes