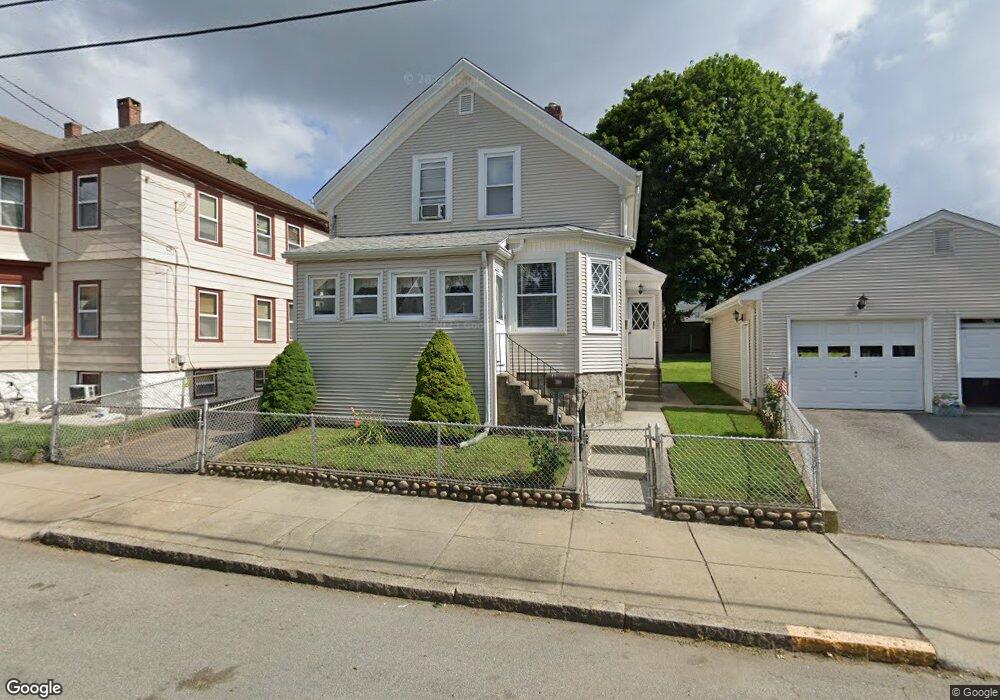
200 Anthony St Fall River, MA 02721
Maplewood NeighborhoodEstimated Value: $399,637 - $519,000
3
Beds
2
Baths
1,477
Sq Ft
$307/Sq Ft
Est. Value
About This Home
This home is located at 200 Anthony St, Fall River, MA 02721 and is currently estimated at $454,159, approximately $307 per square foot. 200 Anthony St is a home located in Bristol County with nearby schools including Letourneau Elementary School, Matthew J. Kuss Middle School, and B M C Durfee High School.
Ownership History
Date
Name
Owned For
Owner Type
Purchase Details
Closed on
Jan 30, 2019
Sold by
Vezina Donald D Est
Bought by
Donald V Vezina Ret 1998
Current Estimated Value
Create a Home Valuation Report for This Property
The Home Valuation Report is an in-depth analysis detailing your home's value as well as a comparison with similar homes in the area
Home Values in the Area
Average Home Value in this Area
Purchase History
| Date | Buyer | Sale Price | Title Company |
|---|---|---|---|
| Donald V Vezina Ret 1998 | -- | -- |
Source: Public Records
Tax History
| Year | Tax Paid | Tax Assessment Tax Assessment Total Assessment is a certain percentage of the fair market value that is determined by local assessors to be the total taxable value of land and additions on the property. | Land | Improvement |
|---|---|---|---|---|
| 2025 | $3,724 | $325,200 | $128,400 | $196,800 |
| 2024 | $3,529 | $307,100 | $123,500 | $183,600 |
| 2023 | $3,296 | $268,600 | $105,900 | $162,700 |
| 2022 | $3,060 | $242,500 | $96,300 | $146,200 |
| 2021 | $2,867 | $207,300 | $89,100 | $118,200 |
| 2020 | $2,865 | $198,300 | $85,300 | $113,000 |
| 2019 | $2,754 | $188,900 | $81,200 | $107,700 |
| 2018 | $2,560 | $175,100 | $79,700 | $95,400 |
| 2017 | $2,463 | $175,900 | $81,300 | $94,600 |
| 2016 | $2,388 | $175,200 | $84,700 | $90,500 |
| 2015 | $2,256 | $172,500 | $81,500 | $91,000 |
| 2014 | $2,249 | $178,800 | $85,800 | $93,000 |
Source: Public Records
Map
Nearby Homes
- 93 Lawton St
- 125 Carl St
- 478 Tucker St
- 539 Aetna St
- 59 Wayne St
- 143 Meeson St
- 186 Spencer St
- 250 Laurel St
- 59 Denver St
- 495 Chicago St
- 250 Nelson St
- 119 Pebble St
- 311 S Oxford St
- 191 Glasgow St Unit 2
- 545 Brayton Ave
- 340 Vale St
- 0 Stafford Rd Unit 1393774
- 0 Stafford Rd Unit 73431501
- 21 Boyden St
- 4 Bronson St
Your Personal Tour Guide
Ask me questions while you tour the home.