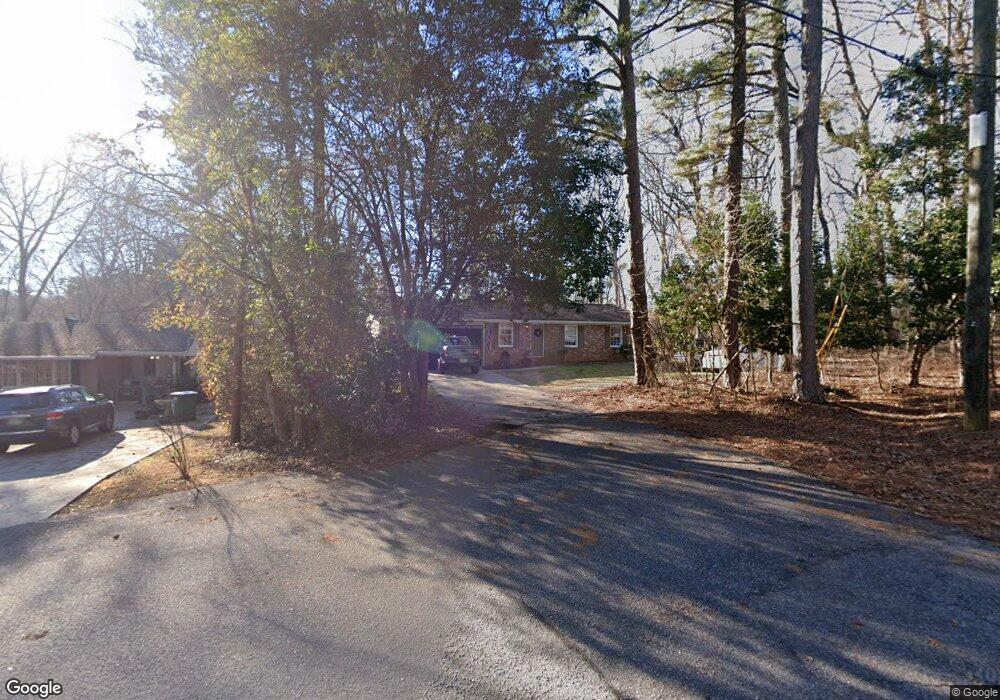
200 Arrowhead Rd Bogart, GA 30622
Estimated Value: $203,931 - $254,000
3
Beds
2
Baths
962
Sq Ft
$235/Sq Ft
Est. Value
About This Home
This home is located at 200 Arrowhead Rd, Bogart, GA 30622 and is currently estimated at $225,733, approximately $234 per square foot. 200 Arrowhead Rd is a home located in Clarke County with nearby schools including Cleveland Road Elementary School, Burney-Harris-Lyons Middle School, and Clarke Central High School.
Ownership History
Date
Name
Owned For
Owner Type
Purchase Details
Closed on
Dec 17, 2021
Sold by
Rowden Donna Kendrick
Bought by
Sam Patrick and Nguyen Pham Hoai
Current Estimated Value
Purchase Details
Closed on
Aug 17, 2017
Sold by
Rowden Gaston Dale
Bought by
Rowden Donna Kendrick
Purchase Details
Closed on
Sep 16, 2010
Sold by
Afb
Bought by
Rowden Dale
Purchase Details
Closed on
Jan 5, 2010
Sold by
Bonner Stacy W
Bought by
Afb
Purchase Details
Closed on
Nov 1, 2005
Sold by
Couch Christopher R and Couch Stacy W
Bought by
Bonner Stacy W
Purchase Details
Closed on
Nov 16, 2004
Sold by
Sands Inc
Bought by
Couch Christopher R and Bonne Stacy W
Purchase Details
Closed on
Jan 30, 2003
Sold by
Staines M Jay & Harry Spratlin
Bought by
Staines M Jay & Harry Spratlin
Purchase Details
Closed on
Dec 11, 2002
Sold by
Whitley Kathlyne H
Bought by
Staines M Jay & Harry Spratlin
Create a Home Valuation Report for This Property
The Home Valuation Report is an in-depth analysis detailing your home's value as well as a comparison with similar homes in the area
Home Values in the Area
Average Home Value in this Area
Purchase History
| Date | Buyer | Sale Price | Title Company |
|---|---|---|---|
| Sam Patrick | $153,000 | -- | |
| Rowden Donna Kendrick | -- | -- | |
| Rowden Dale | $50,000 | -- | |
| Afb | $90,000 | -- | |
| Bonner Stacy W | -- | -- | |
| Couch Christopher R | -- | -- | |
| Sands Inc | -- | -- | |
| Staines M Jay & Harry Spratlin | -- | -- | |
| Staines M Jay & Harry Spratlin | $72,000 | -- |
Source: Public Records
Tax History Compared to Growth
Tax History
| Year | Tax Paid | Tax Assessment Tax Assessment Total Assessment is a certain percentage of the fair market value that is determined by local assessors to be the total taxable value of land and additions on the property. | Land | Improvement |
|---|---|---|---|---|
| 2025 | $2,344 | $75,501 | $12,000 | $63,501 |
| 2024 | $2,344 | $70,844 | $12,000 | $58,844 |
| 2023 | $2,214 | $64,307 | $12,000 | $52,307 |
| 2022 | $1,795 | $56,276 | $12,000 | $44,276 |
| 2021 | $1,163 | $34,512 | $10,400 | $24,112 |
| 2020 | $1,154 | $34,245 | $10,400 | $23,845 |
| 2019 | $1,122 | $33,053 | $10,400 | $22,653 |
| 2018 | $932 | $27,463 | $8,000 | $19,463 |
| 2017 | $878 | $25,864 | $8,000 | $17,864 |
| 2016 | $886 | $26,107 | $8,000 | $18,107 |
| 2015 | $900 | $26,476 | $8,000 | $18,476 |
| 2014 | $915 | $26,872 | $8,000 | $18,872 |
Source: Public Records
Map
Nearby Homes
- 165 Mill Center Blvd Unit 208
- 165 Mill Center Blvd Unit 204
- 165 Mill Center Blvd Unit 104
- 165 Mill Center Blvd Unit 208
- 165 Mill Center Blvd Unit 104
- 165 Mill Center Blvd Unit 204
- 211 Littleton Way
- 240 Cleveland Ave Unit 105
- 240 Cleveland Rd Unit 105
- 160 Cambridge Dr
- 323 Summerville Ln
- 170 Huntington Ct
- 321 Summerville Ln
- 315 Summerville Ln
- 311 Summerville Ln
- 117 Covington Place
- 200 Arrowhead Rd
- 210 Arrowhead Rd
- 220 Arrowhead Rd
- 160 Arrowhead Rd
- 125 Mellwood Dr
- 125 Mellwood Dr
- 145 Mellwood Dr
- 185 Arrowhead Rd
- 230 Arrowhead Rd
- 240 Arrowhead Rd
- 150 Arrowhead Rd
- 255 Arrowhead Rd
- 175 Arrowhead Rd
- 3722 Atlanta Hwy
- 3722 Atlanta Hwy Unit 4
- 138 Mellwood Dr
- 140 Arrowhead Rd
- 120 Mellwood Dr
- 335 Arrowhead Rd
- 365 Arrowhead Rd