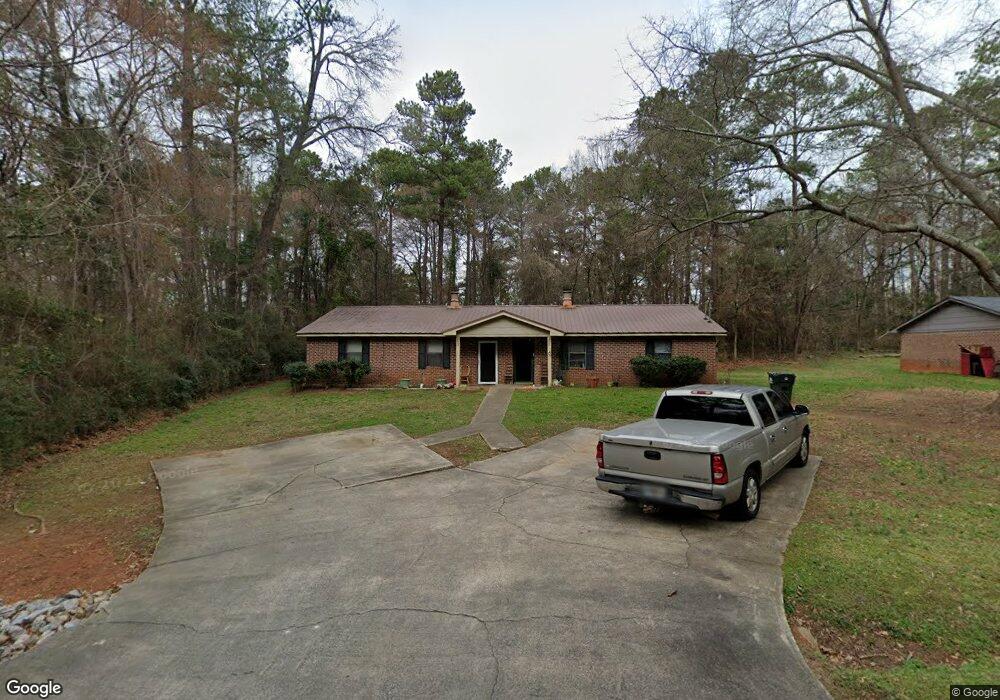
200 Ashmore Dr Athens, GA 30601
Estimated Value: $256,000 - $265,000
4
Beds
4
Baths
1,846
Sq Ft
$140/Sq Ft
Est. Value
About This Home
This home is located at 200 Ashmore Dr, Athens, GA 30601 and is currently estimated at $258,603, approximately $140 per square foot. 200 Ashmore Dr is a home located in Clarke County with nearby schools including Fowler Drive Elementary School, Coile Middle School, and Cedar Shoals High School.
Ownership History
Date
Name
Owned For
Owner Type
Purchase Details
Closed on
Jun 12, 2014
Sold by
Providentn Funding Associa
Bought by
Bugg George C
Current Estimated Value
Purchase Details
Closed on
Jun 4, 2013
Sold by
Varghese Sara B
Bought by
Providentn Funding Associates
Purchase Details
Closed on
Jul 26, 2007
Sold by
Not Provided
Bought by
Varghese Sara B
Home Financials for this Owner
Home Financials are based on the most recent Mortgage that was taken out on this home.
Original Mortgage
$67,500
Interest Rate
6.63%
Mortgage Type
New Conventional
Purchase Details
Closed on
Sep 30, 1999
Sold by
Lariscy Joseph E
Bought by
Matthews James D
Purchase Details
Closed on
Jan 14, 1997
Sold by
Umlic-Seven Corp
Bought by
Lariscy Joseph E
Purchase Details
Closed on
Feb 6, 1996
Sold by
Sims Fayette
Bought by
Umlic-Seven Corp
Create a Home Valuation Report for This Property
The Home Valuation Report is an in-depth analysis detailing your home's value as well as a comparison with similar homes in the area
Home Values in the Area
Average Home Value in this Area
Purchase History
| Date | Buyer | Sale Price | Title Company |
|---|---|---|---|
| Bugg George C | $32,500 | -- | |
| Providentn Funding Associates | $26,000 | -- | |
| Varghese Sara B | $75,000 | -- | |
| Matthews James D | $64,000 | -- | |
| Lariscy Joseph E | $55,000 | -- | |
| Umlic-Seven Corp | $38,700 | -- |
Source: Public Records
Mortgage History
| Date | Status | Borrower | Loan Amount |
|---|---|---|---|
| Previous Owner | Varghese Sara B | $67,500 |
Source: Public Records
Tax History Compared to Growth
Tax History
| Year | Tax Paid | Tax Assessment Tax Assessment Total Assessment is a certain percentage of the fair market value that is determined by local assessors to be the total taxable value of land and additions on the property. | Land | Improvement |
|---|---|---|---|---|
| 2025 | $3,181 | $102,435 | $12,000 | $90,435 |
| 2024 | $2,749 | $87,967 | $12,000 | $75,967 |
| 2023 | $2,749 | $71,611 | $10,400 | $61,211 |
| 2022 | $1,893 | $59,348 | $10,400 | $48,948 |
| 2021 | $914 | $27,135 | $8,000 | $19,135 |
| 2020 | $1,243 | $36,887 | $8,000 | $28,887 |
| 2019 | $1,157 | $34,092 | $8,000 | $26,092 |
| 2018 | $1,083 | $31,898 | $7,200 | $24,698 |
| 2017 | $812 | $23,913 | $7,200 | $16,713 |
| 2016 | $812 | $23,913 | $7,200 | $16,713 |
| 2015 | $815 | $23,956 | $7,200 | $16,756 |
| 2014 | $735 | $21,600 | $7,200 | $14,400 |
Source: Public Records
Map
Nearby Homes
- 155 Ashmore Dr
- 140 Loblolly Dr
- 192 Sunny Hills Dr
- 495 Boley Dr
- 0 Danielsville Rd Unit 8926755
- 0 Danielsville Rd Unit 979729
- 210 Hull Rd
- 156 Connally Cir
- 136 Bridgewater Cir
- 464 Ruth St
- 110 Connelly Cir
- 0 Old Commerce Rd Unit 10617666
- 455 Ruth St
- 211 North Ave Unit 1333
- 6006 Smokey
- 239 Ruth St Unit 15
- 118 Ruth Dr Unit 130
- 2146 Danielsville Rd
- 249 Fifth St
- 560 Rosa Nell Howard St