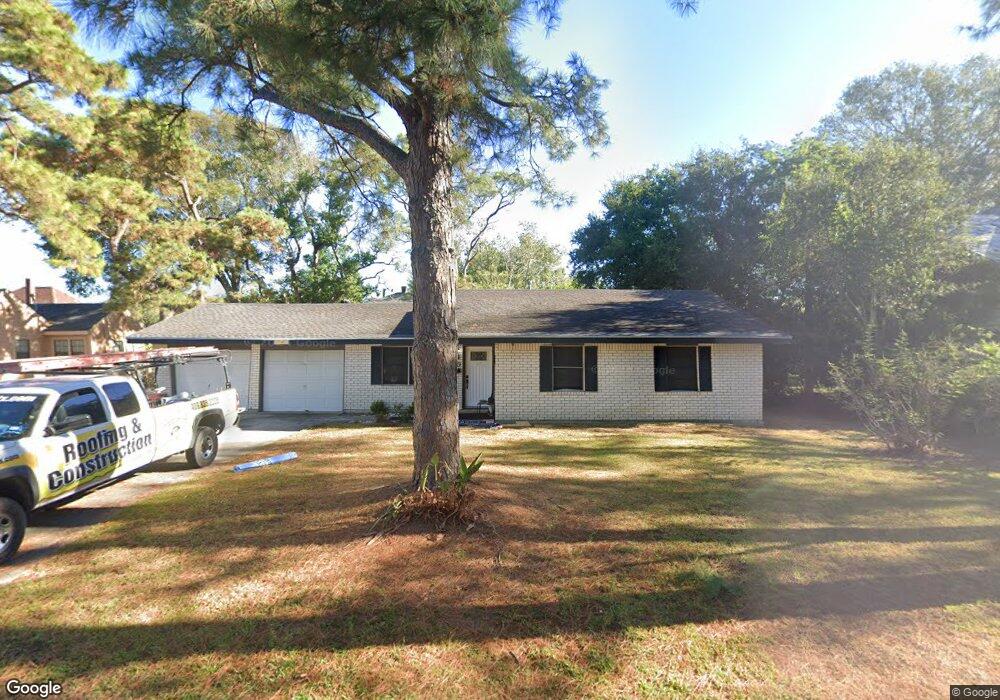
200 Avant Ln Port Arthur, TX 77642
Estimated Value: $84,000 - $136,000
4
Beds
2
Baths
1,460
Sq Ft
$81/Sq Ft
Est. Value
About This Home
This home is located at 200 Avant Ln, Port Arthur, TX 77642 and is currently estimated at $118,439, approximately $81 per square foot. 200 Avant Ln is a home located in Jefferson County with nearby schools including DeQueen Elementary School, Abraham Lincoln Middle School, and Memorial High School.
Ownership History
Date
Name
Owned For
Owner Type
Purchase Details
Closed on
Apr 20, 2018
Sold by
Zuniga Fredy
Bought by
Zuniga Natacha
Current Estimated Value
Purchase Details
Closed on
Apr 18, 2008
Sold by
Houseman Donna Marie Collins
Bought by
Zuniga Fredy L
Home Financials for this Owner
Home Financials are based on the most recent Mortgage that was taken out on this home.
Original Mortgage
$81,357
Outstanding Balance
$51,186
Interest Rate
5.84%
Mortgage Type
FHA
Estimated Equity
$67,253
Create a Home Valuation Report for This Property
The Home Valuation Report is an in-depth analysis detailing your home's value as well as a comparison with similar homes in the area
Home Values in the Area
Average Home Value in this Area
Purchase History
| Date | Buyer | Sale Price | Title Company |
|---|---|---|---|
| Zuniga Natacha | -- | None Available | |
| Zuniga Fredy L | -- | None Available |
Source: Public Records
Mortgage History
| Date | Status | Borrower | Loan Amount |
|---|---|---|---|
| Open | Zuniga Fredy L | $81,357 |
Source: Public Records
Tax History Compared to Growth
Tax History
| Year | Tax Paid | Tax Assessment Tax Assessment Total Assessment is a certain percentage of the fair market value that is determined by local assessors to be the total taxable value of land and additions on the property. | Land | Improvement |
|---|---|---|---|---|
| 2025 | $1,431 | $118,342 | -- | -- |
| 2024 | $1,431 | $107,584 | -- | -- |
| 2023 | $1,431 | $97,804 | $0 | $0 |
| 2022 | $2,824 | $88,913 | $0 | $0 |
| 2021 | $2,679 | $82,526 | $5,640 | $76,886 |
| 2020 | $1,785 | $73,482 | $5,640 | $67,842 |
| 2019 | $2,222 | $69,710 | $5,640 | $64,070 |
| 2018 | $1,613 | $69,710 | $5,640 | $64,070 |
| 2017 | $1,712 | $75,040 | $5,640 | $69,400 |
| 2016 | $2,198 | $75,040 | $5,640 | $69,400 |
| 2015 | $1,792 | $75,040 | $5,640 | $69,400 |
| 2014 | $1,792 | $75,040 | $5,640 | $69,400 |
Source: Public Records
Map
Nearby Homes