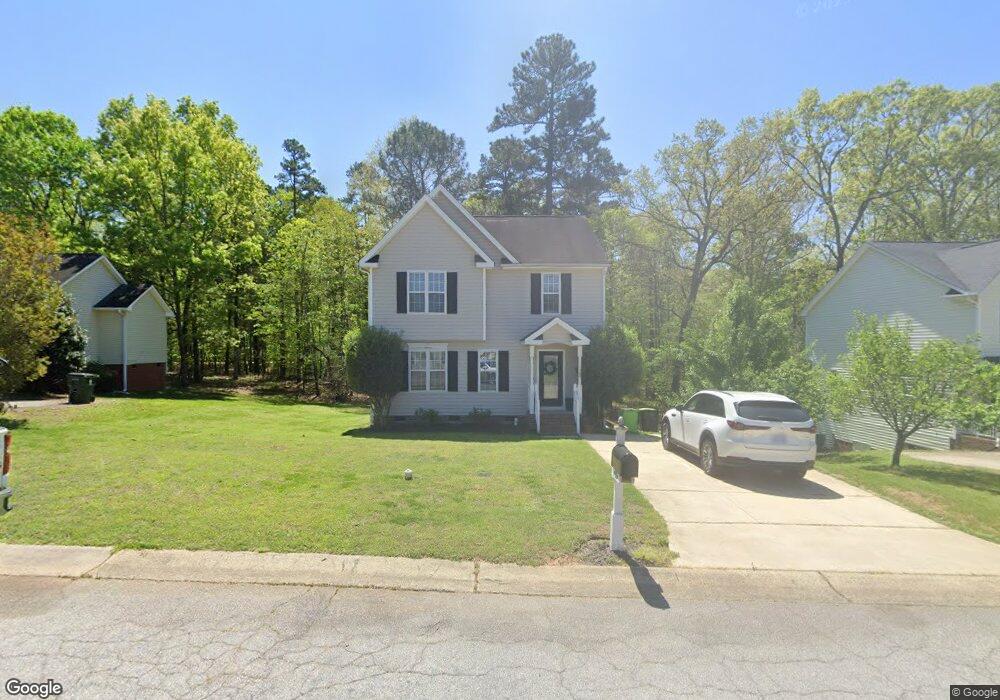
200 Braxberry Way Holly Springs, NC 27540
Estimated Value: $372,000 - $404,000
3
Beds
3
Baths
1,486
Sq Ft
$258/Sq Ft
Est. Value
About This Home
This home is located at 200 Braxberry Way, Holly Springs, NC 27540 and is currently estimated at $383,437, approximately $258 per square foot. 200 Braxberry Way is a home located in Wake County with nearby schools including Holly Grove Elementary School, Holly Grove Middle School, and Holly Springs High School.
Ownership History
Date
Name
Owned For
Owner Type
Purchase Details
Closed on
Dec 7, 2023
Sold by
Sailsbery Joshua K and Stacy Dawn
Bought by
Sailsbery Properties Llc
Current Estimated Value
Purchase Details
Closed on
Feb 11, 2019
Sold by
Opendoor Homes Phoenix 2 Llc
Bought by
Sailsbery Joshua K and Sailsbery Stacy D
Home Financials for this Owner
Home Financials are based on the most recent Mortgage that was taken out on this home.
Original Mortgage
$153,675
Interest Rate
4.5%
Mortgage Type
New Conventional
Purchase Details
Closed on
Jun 6, 2018
Sold by
Skinner Tonia S and Skinner Yallingn K
Bought by
Opendoor Homes Phoenix 2 Llc
Purchase Details
Closed on
Jan 29, 2001
Sold by
New Fortis Corporation The
Bought by
Faulcon Tonia S
Home Financials for this Owner
Home Financials are based on the most recent Mortgage that was taken out on this home.
Original Mortgage
$123,850
Interest Rate
7.44%
Mortgage Type
FHA
Create a Home Valuation Report for This Property
The Home Valuation Report is an in-depth analysis detailing your home's value as well as a comparison with similar homes in the area
Home Values in the Area
Average Home Value in this Area
Purchase History
| Date | Buyer | Sale Price | Title Company |
|---|---|---|---|
| Sailsbery Properties Llc | -- | None Listed On Document | |
| Sailsbery Joshua K | $205,000 | None Available | |
| Opendoor Homes Phoenix 2 Llc | $203,500 | None Available | |
| Faulcon Tonia S | $125,000 | -- |
Source: Public Records
Mortgage History
| Date | Status | Borrower | Loan Amount |
|---|---|---|---|
| Previous Owner | Sailsbery Joshua K | $153,675 | |
| Previous Owner | Faulcon Tonia S | $123,850 | |
| Closed | Opendoor Homes Phoenix 2 Llc | $0 |
Source: Public Records
Tax History Compared to Growth
Tax History
| Year | Tax Paid | Tax Assessment Tax Assessment Total Assessment is a certain percentage of the fair market value that is determined by local assessors to be the total taxable value of land and additions on the property. | Land | Improvement |
|---|---|---|---|---|
| 2025 | $2,924 | $337,415 | $110,000 | $227,415 |
| 2024 | $2,912 | $337,415 | $110,000 | $227,415 |
| 2023 | $2,403 | $220,933 | $55,000 | $165,933 |
| 2022 | $2,320 | $220,933 | $55,000 | $165,933 |
| 2021 | $2,277 | $220,933 | $55,000 | $165,933 |
| 2020 | $2,277 | $220,933 | $55,000 | $165,933 |
| 2019 | $2,113 | $173,956 | $48,000 | $125,956 |
| 2018 | $1,911 | $173,956 | $48,000 | $125,956 |
| 2017 | $1,842 | $173,956 | $48,000 | $125,956 |
| 2016 | $1,817 | $173,956 | $48,000 | $125,956 |
| 2015 | $1,734 | $163,359 | $42,000 | $121,359 |
| 2014 | $1,675 | $163,359 | $42,000 | $121,359 |
Source: Public Records
Map
Nearby Homes
- 161 Summit Oaks Ln
- 425 Cahors Trail
- 100 Avent Pines Ln
- 104 Pointe Park Cir
- 108 Pointe Park Cir
- 305 Tonks Trail
- 1712 Avent Ferry Rd
- 233 Hickory Glen Ln
- 505 Pyracantha Dr
- 113 Braxman Ln
- 209 Devon Fields Dr
- 208 Autumn Glen Ln
- 101 Covenant Rock Ln
- 213 Holly Moor Ln
- 300 Shorehouse Way
- 0 Old Airport Rd
- 609 Ramsours Mill Dr
- 100 Oakmoss Trail
- 417 Shorehouse Way
- 304 Magnolia Meadow Way
- 184 Braxberry Way
- 204 Braxberry Way
- 120 Braxberry Way
- 116 Braxberry Way
- 208 Braxberry Way
- 229 Horn Holly Way
- 229 Hornholly Way
- 177 Braxberry Way
- 179 Braxberry Way
- 183 Braxberry Way
- 189 Braxberry Way
- 117 Braxberry Way
- 112 Braxberry Way
- 225 Hornholly Way
- 216 Hornholly Way
- 205 Braxberry Way
- 113 Braxberry Way
- 212 Braxberry Way
- 212 Baxberry
- 221 Hornholly Way