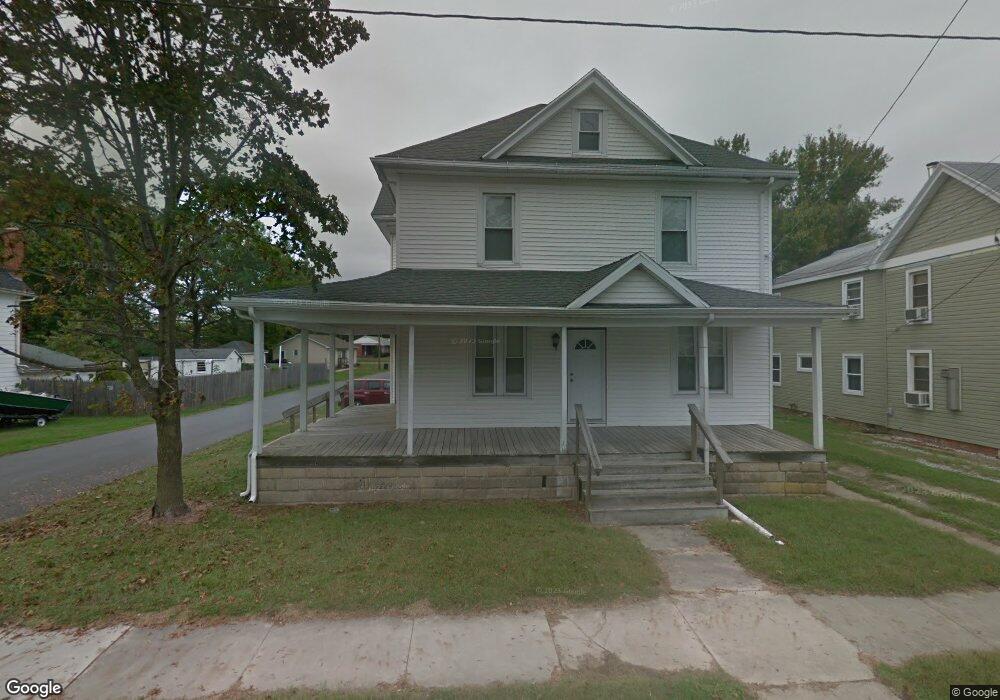
200 Broad St Hurlock, MD 21643
Estimated Value: $189,000 - $234,164
Studio
--
Bath
2,062
Sq Ft
$101/Sq Ft
Est. Value
About This Home
This home is located at 200 Broad St, Hurlock, MD 21643 and is currently estimated at $207,291, approximately $100 per square foot. 200 Broad St is a home located in Dorchester County with nearby schools including Hurlock Elementary School, North Dorchester Middle School, and North Dorchester High School.
Ownership History
Date
Name
Owned For
Owner Type
Purchase Details
Closed on
Feb 3, 2023
Sold by
Hubbard William O
Bought by
Washburn Timothy L
Current Estimated Value
Home Financials for this Owner
Home Financials are based on the most recent Mortgage that was taken out on this home.
Original Mortgage
$189,255
Outstanding Balance
$181,747
Interest Rate
5%
Mortgage Type
VA
Estimated Equity
$25,544
Purchase Details
Closed on
Nov 14, 1996
Sold by
Windsor Ross Bradley
Bought by
Hubbard William O and Hubbard Deborah I
Create a Home Valuation Report for This Property
The Home Valuation Report is an in-depth analysis detailing your home's value as well as a comparison with similar homes in the area
Home Values in the Area
Average Home Value in this Area
Purchase History
| Date | Buyer | Sale Price | Title Company |
|---|---|---|---|
| Washburn Timothy L | $185,000 | Eastern Shore Title | |
| Washburn Timothy L | $185,000 | Eastern Shore Title | |
| Hubbard William O | $32,500 | -- |
Source: Public Records
Mortgage History
| Date | Status | Borrower | Loan Amount |
|---|---|---|---|
| Open | Washburn Timothy L | $189,255 | |
| Closed | Washburn Timothy L | $189,255 |
Source: Public Records
Tax History
| Year | Tax Paid | Tax Assessment Tax Assessment Total Assessment is a certain percentage of the fair market value that is determined by local assessors to be the total taxable value of land and additions on the property. | Land | Improvement |
|---|---|---|---|---|
| 2025 | $2,407 | $139,233 | $0 | $0 |
| 2024 | $1,863 | $109,900 | $26,300 | $83,600 |
| 2023 | $1,863 | $104,233 | $0 | $0 |
| 2022 | $1,795 | $98,567 | $0 | $0 |
| 2021 | $1,597 | $92,900 | $21,300 | $71,600 |
| 2020 | $1,597 | $86,133 | $0 | $0 |
| 2019 | $1,471 | $79,367 | $0 | $0 |
| 2018 | $1,344 | $72,600 | $21,300 | $51,300 |
| 2017 | $1,333 | $71,767 | $0 | $0 |
| 2016 | -- | $70,933 | $0 | $0 |
| 2015 | $1,372 | $70,100 | $0 | $0 |
| 2014 | $1,372 | $70,100 | $0 | $0 |
Source: Public Records
Map
Nearby Homes
- 101 Commerce St
- 207 S Main St
- 219 S Main St
- 405 Collins Ave
- 309 S Main St
- 521 Academy St
- 311 Prospect St
- 406 Charles St
- 105 Center St
- 101 Thompson St
- 111 Martin Dr
- 4445 Rolling Acres Dr
- 0 Gravel Branch Rd Unit MDDO2001942
- 6720 Bobtown Rd
- 6749 Bobtown Rd
- 4714 Payne Rd
- 4907 Payne Rd
- 4604 Payne Rd
- 6819 Bobtown Rd
- 6132 Palmer Mill Rd
Your Personal Tour Guide
Ask me questions while you tour the home.