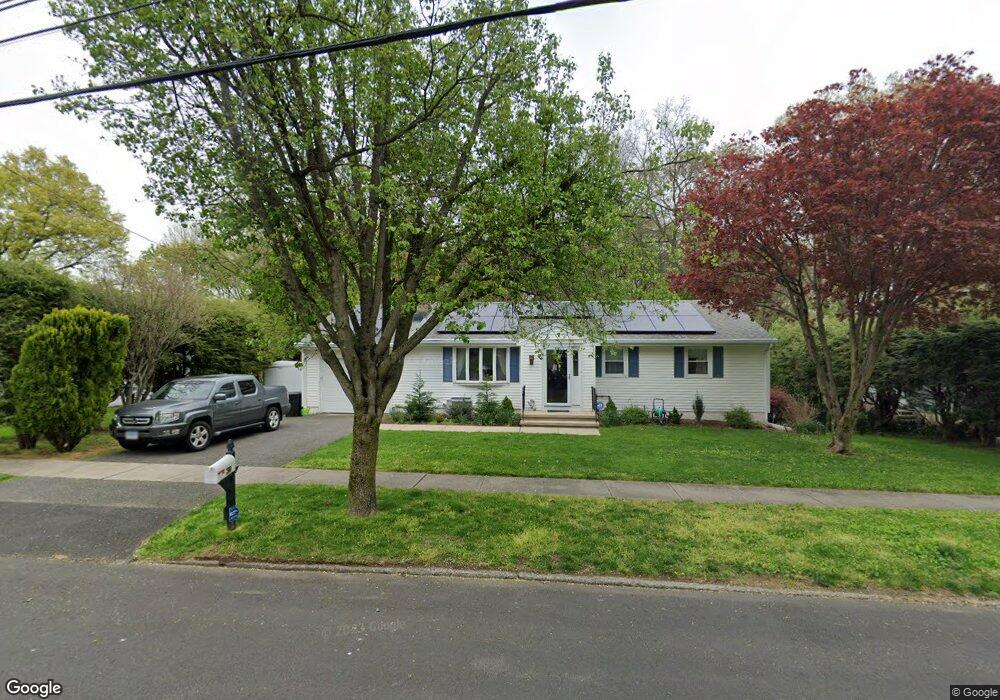
200 Bunnyview Dr Stratford, CT 06614
Estimated Value: $283,000 - $522,134
3
Beds
3
Baths
1,514
Sq Ft
$290/Sq Ft
Est. Value
About This Home
This home is located at 200 Bunnyview Dr, Stratford, CT 06614 and is currently estimated at $439,284, approximately $290 per square foot. 200 Bunnyview Dr is a home located in Fairfield County with nearby schools including Chapel Street Elementary School, Harry B. Flood Middle School, and Bunnell High School.
Ownership History
Date
Name
Owned For
Owner Type
Purchase Details
Closed on
May 25, 2023
Sold by
Schumacher John A
Bought by
Schumacher John A
Current Estimated Value
Home Financials for this Owner
Home Financials are based on the most recent Mortgage that was taken out on this home.
Original Mortgage
$622,500
Outstanding Balance
$622,023
Interest Rate
7.54%
Mortgage Type
Adjustable Rate Mortgage/ARM
Estimated Equity
-$182,739
Purchase Details
Closed on
Aug 19, 2022
Sold by
Perez Bonnie
Bought by
Schumacher John
Purchase Details
Closed on
Dec 21, 2012
Sold by
Perez Bonnie J and Schumacher Kathleen
Bought by
200 Bunnyview Dr Strat
Purchase Details
Closed on
Dec 6, 1984
Bought by
200 Bunnyview Dr Ret
Create a Home Valuation Report for This Property
The Home Valuation Report is an in-depth analysis detailing your home's value as well as a comparison with similar homes in the area
Home Values in the Area
Average Home Value in this Area
Purchase History
| Date | Buyer | Sale Price | Title Company |
|---|---|---|---|
| Schumacher John A | -- | None Available | |
| Schumacher John A | -- | None Available | |
| Schumacher John | $200,000 | None Available | |
| Schumacher Kathleen Est | -- | None Available | |
| Perez Bonnie | -- | None Available | |
| Schumacher Kathleen Est | -- | None Available | |
| 200 Bunnyview Dr Strat | -- | -- | |
| Perez Bonnie J | -- | -- | |
| Perez Bonnie J | -- | -- | |
| 200 Bunnyview Dr Ret | -- | -- | |
| 200 Bunnyview Dr Strat | -- | -- |
Source: Public Records
Mortgage History
| Date | Status | Borrower | Loan Amount |
|---|---|---|---|
| Open | Schumacher John A | $622,500 | |
| Closed | Schumacher John A | $622,500 | |
| Closed | Schumacher John A | $622,500 |
Source: Public Records
Tax History Compared to Growth
Tax History
| Year | Tax Paid | Tax Assessment Tax Assessment Total Assessment is a certain percentage of the fair market value that is determined by local assessors to be the total taxable value of land and additions on the property. | Land | Improvement |
|---|---|---|---|---|
| 2025 | $8,068 | $200,690 | $104,090 | $96,600 |
| 2024 | $8,068 | $200,690 | $104,090 | $96,600 |
| 2023 | $8,068 | $200,690 | $104,090 | $96,600 |
| 2022 | $7,919 | $200,690 | $104,090 | $96,600 |
| 2021 | $7,921 | $200,690 | $104,090 | $96,600 |
| 2020 | $7,955 | $200,690 | $104,090 | $96,600 |
| 2019 | $7,343 | $184,170 | $87,570 | $96,600 |
| 2018 | $7,348 | $184,170 | $87,570 | $96,600 |
| 2017 | $7,361 | $184,170 | $87,570 | $96,600 |
| 2016 | $7,181 | $184,170 | $87,570 | $96,600 |
| 2015 | $6,811 | $184,170 | $87,570 | $96,600 |
| 2014 | $6,574 | $184,520 | $90,230 | $94,290 |
Source: Public Records
Map
Nearby Homes
- 30 Bulmer Dr
- 80 Wilbrook Rd
- 15 Tavern Rock Rd
- 1462 Cutspring Rd
- 160 Cheshire St
- 175 Twin Oaks Terrace
- 80 Sheffield Cir
- 260 Goldbach Dr
- 1314 Huntington Rd
- 717 Hawley Glen Unit 18
- 360 Nutmeg Ln Unit 360
- 55 Harvest Ridge Rd
- 25 Harvest Ridge Rd
- 70 Valley Brook Terrace
- 145 River Valley Rd
- 246 Delaware Dr
- 40 Delaware Dr
- 620 Peters Ln
- 420 Peters Ln
- 500 Peters Ln
- 220 Bunnyview Dr
- 180 Bunnyview Dr
- 165 Bunnyview Dr
- 240 Bunnyview Dr
- 225 Bunnyview Dr
- 160 Bunnyview Dr
- 145 Bunnyview Dr
- 205 Bunnyview Dr
- 235 Bunnyview Dr
- 95 Lilibeth Dr
- 260 Bunnyview Dr
- 30 Cherry Hill Rd
- 50 Cherry Hill Rd
- 80 Lilibeth Dr
- 224 Cedar Knoll Dr
- 125 Bunnyview Dr
- 75 Lilibeth Dr
- 255 Bunnyview Dr
- 154 Cedar Knoll Dr
- 204 Cedar Knoll Dr